2025 W31 - S&P 500's Strong 2Q 2025 Earnings Driven by Low Expectations and Tariff Mitigation, Alongside AI-Fueled Structural Shifts and Persistent Magnificent 7 Leadership - 低预期与关税应对策略驱动,兼论AI赋能的结构性转变与“七巨头”的持续领先

Key Logic
Analysis reports from Goldman Sachs Global Investment Research and Citi jointly reveal two critical dimensions of current S&P 500 market dynamics. In the short term, the S&P 500 exhibited robust earnings growth during the Q2 2025 earnings season, primarily due to overly conservative analyst expectations. Concurrently, corporations demonstrated confidence in addressing tariff-induced margin pressure through supply chain management, price increases, and cost reduction strategies. From a long-term perspective, Citi emphasizes that AI-driven structural transformation is reshaping the S&P 500. AI-related stocks continue to show superior performance in terms of market capitalization, earnings contribution, valuation reasonableness, earnings quality, and operational efficiency. This aligns with the exceptional performance of Mega-cap tech highlighted in the Goldman Sachs Global Investment Research report, collectively underpinning the index's overall ascent and signaling an AI-led structural bull market. Moving forward, the market's focus is expected to gradually shift from AI enablers to broader AI technology adopters.
S&P 500 Q2 2025 Earnings Season Performance and Market Reaction
To date, the Q2 2025 earnings season has shown strong performance, with approximately two-thirds of S&P 500 companies having reported results.
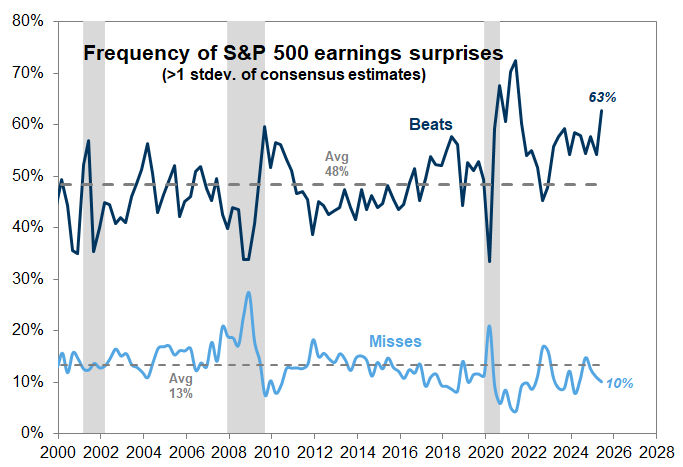
Beat Frequency Hits 25-Year High
63% of companies beat consensus EPS estimates, marking one of the highest EPS beat frequencies in the past 25 years.
S&P 500 Earnings Surprise Frequency
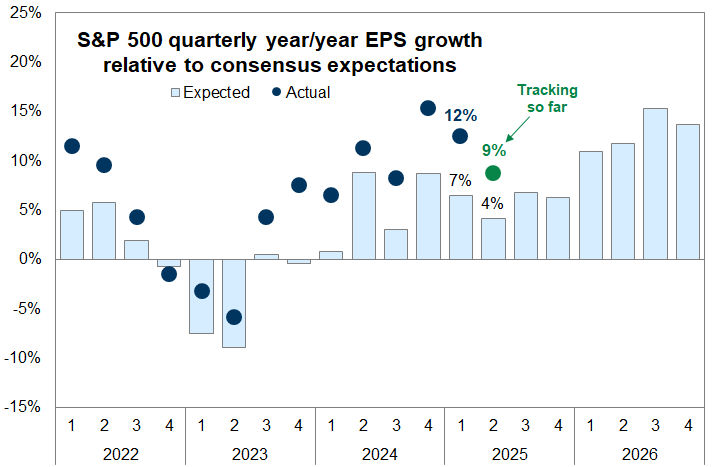
Aggregate S&P 500 EPS grew 9% year-over-year, exceeding the consensus expectation of 4% at the start of the earnings season. Both revenue and margins contributed positively to earnings surprises, with average earnings beats of +8% and average sales beats of +3%.
S&P 500 EPS Growth vs. Consensus
Modest Market Reward for Earnings Beats
Despite most companies beating expectations, the market's reaction was subdued. The median stock beating estimates outperformed the S&P 500 by only 55 bp on the day following its report, below the historical median of 101 bp. Companies missing estimates lagged by twice the historical average. This is primarily attributed to analysts lowering expectations ahead of the earnings season, setting a low bar.
Performance of EPS Beat and Miss Companies

Forward Guidance and Corporate Confidence in Tariff Mitigation
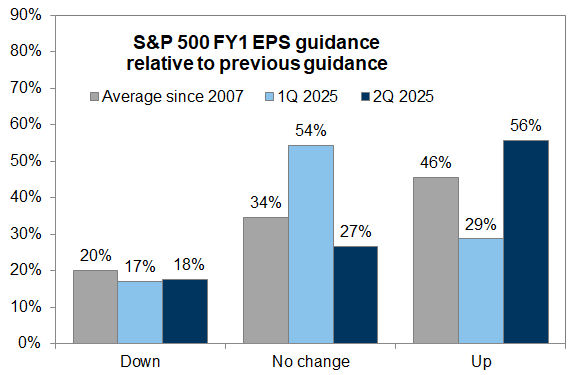
Significant Increase in Companies Raising Guidance
Among companies providing full-year EPS guidance, 56% raised their guidance, nearly double that of Q1. In the Q1 earnings season, over 50% of companies maintained their FY1 EPS guidance, reflecting uncertainty regarding trade policy outlook. This quarter, the proportion of companies maintaining unchanged guidance roughly halved, while those raising guidance almost doubled.
Company FY1 Guidance Change
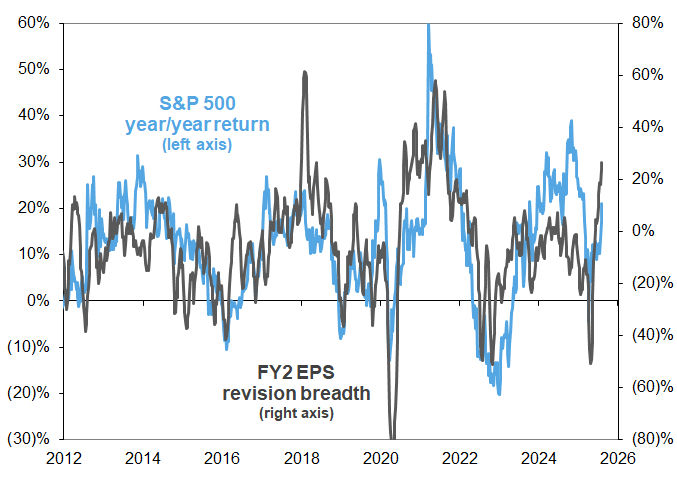
Analyst EPS Estimate Revision Breadth Surges
FY2 earnings revision breadth (measuring the relative frequency of upward vs. downward revisions) surged to its highest level since the end of 2021.
S&P 500 EPS Revision Breadth
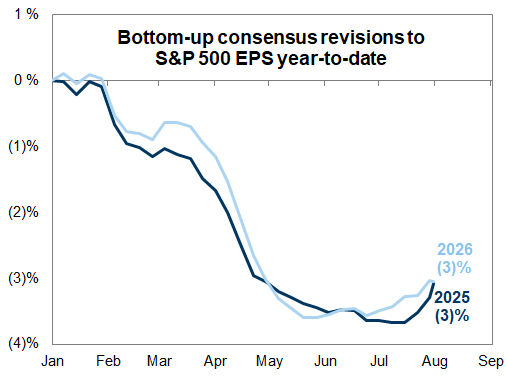
Consensus Expectations Still Below Early-Year Levels
Despite recent improvements, consensus EPS estimates for 2025 and 2026 remain approximately 3% lower than at the start of 2025 (prior to tariff announcements). Consensus EPS growth estimates for 2026 have largely remained unchanged throughout the year.
S&P 500 YTD Consensus Revisions
Companies Confident in Mitigating Tariff Impacts
Among companies discussing tariff impacts, 27% explicitly stated that the negative impact of tariffs on margins would be less than previously estimated.
Key Mitigation Strategies: Companies are employing various tools to offset tariff-induced cost pressures.
How Companies Plan to Mitigate Tariff Impacts
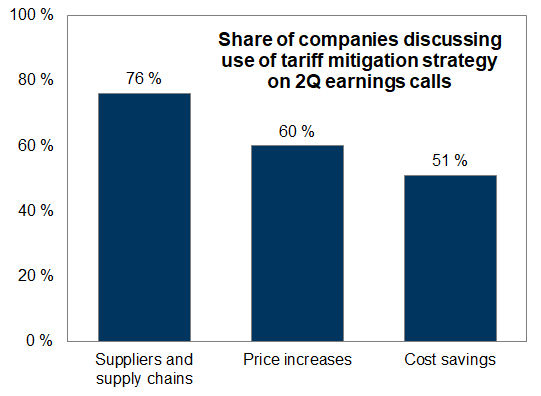
Supply Chain Management: 76% of companies mentioned addressing this through negotiations with suppliers or supply chain restructuring.
Price Increases: 60% of companies mentioned passing on costs through higher product prices.
Cost Reduction: 51% of companies mentioned alleviating pressure through cutting other costs.
Price Increases Signal Inflationary Pressure: The high proportion of companies mentioning price increases supports Goldman Sachs Global Investment Research economists' expectation that tariffs will continue to push up inflation in the coming months.
S&P 500 Net Profit Margin

AI's Structural Impact on S&P 500 and Valuation Analysis
Citi utilized its Theme Machine classification system to categorize S&P 500 constituents into three groups: AI-related, non-AI Tech, and Other, to assess the impact of AI build-out and adoption trends on the S&P 500's fundamental structure.
- AI-related: Comprises 84 stocks, accounting for nearly 50% (precisely 48.4%) of the S&P 500's market capitalization and contributing 35% of the index's current earnings. Of this, 41.4% of the market cap belongs to AI-related Growth, with another 7.5% in AI-related Cyclicals and Defensives.
- non-AI Tech: Includes 147 stocks, representing approximately 25% of market cap and contributing 24% of the index's earnings.
- Other: Consists of 269 stocks, accounting for approximately 25% of market cap and contributing 41% of the index's earnings.
S&P 500 Market Cap Distribution by AI, Non-AI Tech, and Other

S&P 500 Constituent Count by AI, Non-AI Tech, and Other

Performance and Valuation Analysis
Since late 2022, AI-related stocks have significantly outperformed the other two categories.
S&P 500 Total Return by AI, Non-AI Tech, and Other (Since 2022)

Traditional valuation metrics indicate that AI-related stocks are at the 95th percentile for P/E, non-AI Tech even higher at 97th, while Other stocks are at the 77th percentile.
S&P 500 Forward P/E (20 Years) by AI, Non-AI Tech, and Other

However, the report emphasizes that the PEG Ratio (Price-to-Earnings to Growth ratio) better reflects valuation reasonableness. From a PEG Ratio perspective, AI-related stocks demonstrate stronger growth expectations over the next year, and their PEG Ratio is lower compared to non-AI Tech and Other stocks, indicating more reasonable valuations.
S&P 500 PEG Ratio by AI, Non-AI Tech, and Other

Earnings Revision Trends: Since the April low, earnings revision trends for AI and non-AI Tech stocks have been stronger than the rest of the index, further supporting their valuation reasonableness.
S&P 500 Earnings Revisions (5 Years) by AI, Non-AI Tech, and Other

AI-Driven Earnings Trajectory and Efficiency Metrics
Earnings Sharpe Ratio: Citi introduced the 'Earnings Sharpe Ratio' as a metric to gauge the quality of earnings growth. AI-related stocks have excelled on this metric, demonstrating stronger growth with similar volatility, leading to a higher Earnings Sharpe Ratio, consistent with Citi's "growth is defensive" philosophy.
S&P 500 TTM EPS (Base 100) and "Earnings Sharpe Ratio" by AI, Non-AI Tech, and Other

Drivers of Earnings Growth
Over the past 10 years, AI-related stocks' EPS growth has primarily benefited from strong sales trends and operating leverage, with continuous gross margin improvement.
S&P 500 AI-Related Stocks EPS Growth Decomposition (10 Years)

S&P 500 Non-AI Tech Related Stocks EPS Growth Decomposition (10 Years)

S&P 500 Rest of Index Stocks EPS Growth Decomposition (10 Years)

Gross Margin Improvement: AI-related stocks have shown continuous gross margin improvement, reflecting the operating leverage effect and enhanced operational efficiency as their business models mature.
S&P 500 Gross Margin (10 Years) by AI, Non-AI Tech, and Other

Other Efficiency Metrics
Sales per Employee: AI and non-AI Tech stocks have seen sales per employee grow faster than employee headcount, indicating sustained operating leverage.
S&P 500 Sales per Employee (10 Years) by AI, Non-AI Tech, and Other

ROE (Return on Equity): AI-related S&P 500 companies have demonstrated a clear ROE premium and expansion over the past 10 years, while non-AI Tech remained stable, and Other categories fluctuated with economic cycles.
S&P 500 ROE (10 Years) by AI, Non-AI Tech, and Other

Asset Turnover Ratio: As the tech investment cycle enters a more balanced phase of investment and cash generation, the asset turnover ratio for AI and non-AI Tech is rising.
S&P 500 Asset Turnover Ratio (10 Years) by AI, Non-AI Tech, and Other

Operating Leverage: The AI and non-AI Tech sectors exhibit the strongest operating leverage effects, whereas the rest of the S&P 500 (Other) has an operating leverage ratio below 1.00.
S&P 500 Operating Leverage (10 Years) by AI, Non-AI Tech, and Other

Summary: The higher a company's correlation with technology themes (especially AI), the better its operational efficiency and leverage.
Industry Group Perspective on Efficiency Metrics and the Continued Drive of Mega-cap tech
The Citi report further segmented stocks by industry groups (Growth, Cyclicals, Defensives) and analyzed key efficiency and productivity metrics in conjunction with AI thematic exposure.
Earnings Sharpe Ratio: AI-related stocks exhibited a better growth-to-EPS volatility ratio within the Growth and Cyclicals industry groups. However, this advantage was less pronounced in Defensives industries, as defensive sectors typically possess stronger pricing power (e.g., Utilities).
S&P 500 Median Earnings Sharpe Ratio by Industry Group and Thematic Exposure

Gross Margin: Companies with higher correlation to AI or non-AI Tech themes showed better gross margin performance, consistent with the expectation of improved operational efficiency through technology.
S&P 500 Median Gross Margin by Industry Group and Thematic Exposure

ROE: AI-related stocks demonstrated similar advantages in ROE. Notably, the Defensives industry group showed the least differentiation. While fewer in number, Other Growth stocks performed exceptionally well in ROE, even surpassing AI-related stocks. In Cyclicals industries, more AI and tech-related companies delivered better returns.
S&P 500 Median ROE by Industry Group and Thematic Exposure

Mega-cap tech Continues to Exhibit Exceptional Earnings Power (Source: Goldman Sachs Global Investment Research)
MSFT, META, GOOGL, AAPL, and AMZN all reported earnings and sales beats. The Mega-cap tech companies, including Nvidia (yet to report, scheduled for August 27), achieved 26% year-over-year EPS growth in Q2. In contrast, the remaining 493 companies in the S&P 500 saw EPS growth of only 4%. The earnings growth differential between the two groups was a significant 22 pp, exceeding the 14 pp anticipated at the start of the earnings season.
Mega-cap tech vs. S&P 493 Earnings Growth Comparison

The Mega-cap tech are the primary source of upside risk to S&P 500 earnings growth.
Outlook
Goldman Sachs Global Investment Research maintains a balanced view on S&P 500 earnings forecast risk. Goldman Sachs Global Investment Research forecasts S&P 500 2025 EPS at $262 (+7% year-over-year growth), with consensus estimates at $267 (bottom-up) and $261 (top-down). Goldman Sachs Global Investment Research forecasts S&P 500 2026 EPS at $280 (+7% year-over-year growth), with consensus estimates at $302 (bottom-up) and $285 (top-down).
Positive Earnings Outlook Factors: Q2 results indicate companies' ability to offset most tariff-induced margin pressure, and fiscal policy is expected to provide a modest tailwind to earnings growth in 2026.
Negative Earnings Outlook Factors: Tariff pressures are anticipated to increase in the second half of the year; while companies can pass on costs through price increases, this could suppress real revenue growth.
Citi believes that AI's impact on the S&P 500 has been evident over the past 2 years, building the foundation for a structural bull market through continuous operating leverage and efficiency improvements. Moving forward, the key will be the transition from AI enablers to broader AI technology adopters to enhance more widespread earnings visibility and productivity metrics, thereby realizing higher terminal value.


