
AQR's Objective vs. Subjective Return Expectations - US Equity Outperformance and Guiding Long-Term Investment Strategy - AQR关于客观与主观回报预期的系列研究:解构美股超额表现与长期投资策略的启示
Does past performance or current valuation truly dictate future long-term equity returns, especially for the outperforming United States market?
Core Logic and Argumentation Framework
The central thesis of the entire AQR report series is: Investors' expectations for long-term returns should not be based on past returns (especially recent performance), as this "subjective" extrapolation has historically proven to be dangerous and misleading. Instead, investors should adopt an "objective" forward-looking approach based on current market valuations and yields, as this method has statistical advantages in predicting future multi-year returns.
This core thesis is developed through six progressively detailed papers:
- Theoretical Foundation (Part 1): Establishes the core binary framework of "objective expectations" versus "subjective expectations," pointing out that their divergence during extreme market periods is a source of risk.
- Core Application (Part 2): Applies this framework to the most pressing current issue – the outperformance of United States equities, arguing that it is primarily driven by unsustainable valuation expansion rather than fundamental advantages, warning of mean reversion risks.
- Behavioral Explanation (Part 3): Delves into an interesting phenomenon – why bond investors tend to be contrarian (mean reversion) while equity investors tend to extrapolate? It proposes that "information salience" is the key psychological explanation.
- Historical Perspective (Part 4): Traces the history of investment thought, demonstrating the evolution from relying on historical average returns to adopting forward-looking valuation methods, providing historical legitimacy for the methodology advocated by AQR.
- Data Deconstruction (Part 5): Deconstructs the historical returns of United States equities, quantitatively demonstrating the extent to which recent strong returns have been contributed by unsustainable valuation increases and anomalous earnings growth, thereby undermining the rationale for extrapolating recent history.
- Methodology Details (Part 6): Elaborates on the construction of the "objective expected return" model (such as CAPE/CAEY) and candidly assesses the advantages and limitations of its predictive power, ultimately confirming its status as the best tool for long-term forecasting.
1. Theoretical Foundation: Objective vs. Subjective Expectations (The Danger of Rearview-Mirror Thinking)
The first paper, How Do Investors Form Long-Run Return Expectations?, lays the theoretical groundwork for the entire series, proposing two core modes by which investors form return expectations:
- Objective Expectations (Forward-looking):
- Source: Based on current Market Yield and Valuation, such as Shiller's Cyclically-Adjusted Earnings Yield (CAEY, the inverse of CAPE).
- Characteristics: Contrarian. High valuations imply low expected returns, and vice versa. This represents the rational return required by the market for bearing risk.
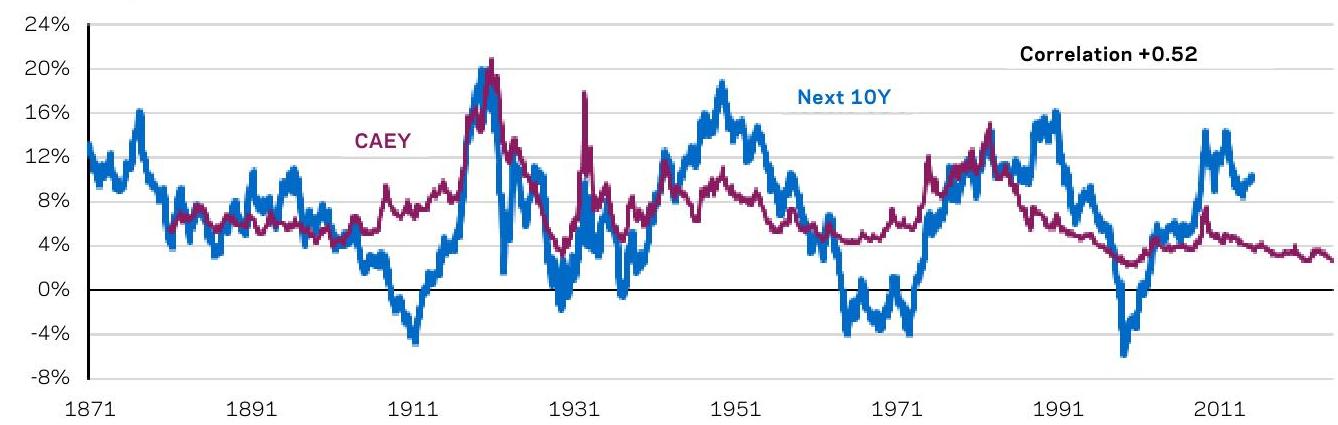
- Predictive Power: Historical data shows that initial CAEY has a significant positive correlation with future 10-year market returns (correlation of +0.52), making it an effective tool for long-term forecasting.
- Starting yield (inverse of valuation) predicts positively, but not perfectly.
Subjective vs. Objective Real Return Expectations
- Subjective Expectations (Rearview-mirror):
- Source: Primarily based on simple extrapolation of past 3 to 10 years of returns, common among individual investors and some analysts.
- Characteristics: Pro-cyclical. Expectations are high after bull markets and low after bear markets.
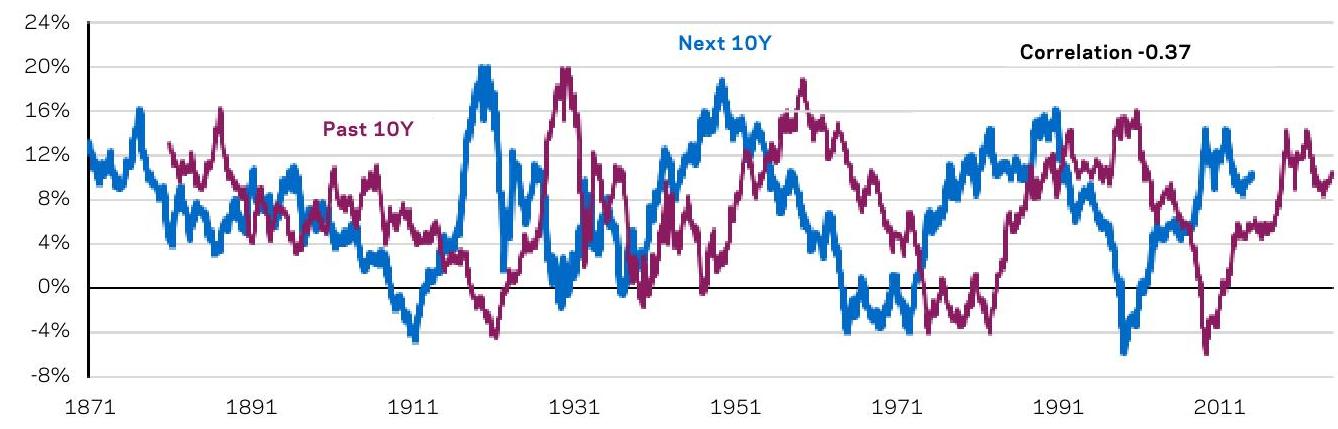
- Predictive Power: Historical data shows that past 10-year returns are negatively correlated with future 10-year returns (correlation of -0.37), making it a directionally flawed and dangerous forecasting method.
- Rearview mirror (past 10-year returns) predicts the wrong direction.
Past 10Y vs. Next 10Y Real Return
The core warning of the report is that these two types of expectations diverge significantly during extreme market periods. For example, at the market peaks in 2000 and 2021, subjective expectations soared due to past glories, while objective expectations were at rock bottom due to overvaluation. History ultimately proved the correctness of objective expectations.
Objective vs. Subjective Real Return Expectations
2. Core Application: Deconstructing the "American Exceptionalism" in Equities
The second paper, Exceptional Expectations: U.S. vs. Non-U.S. Equities, applies the aforementioned theoretical framework to the sustained outperformance of United States equities relative to global markets.
- Core Finding: The outperformance of United States equities over the past few decades has been primarily driven by a sharp expansion in its relative valuation, rather than a sustained advantage in its earnings growth.
- Since 1990, the United States' relative return (hedged) has been as high as 4.7% annually, with valuation changes contributing 3.8%, far exceeding the 1.1% difference in real EPS growth.
- By the end of 2024, the United States' CAPE was almost two times that of non-United States markets, reaching historical extreme levels.
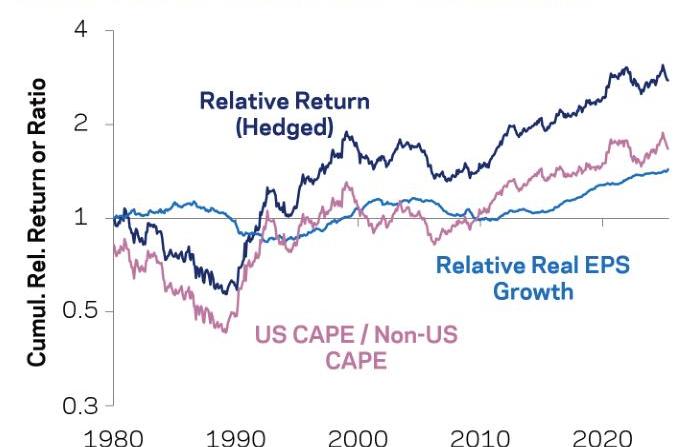
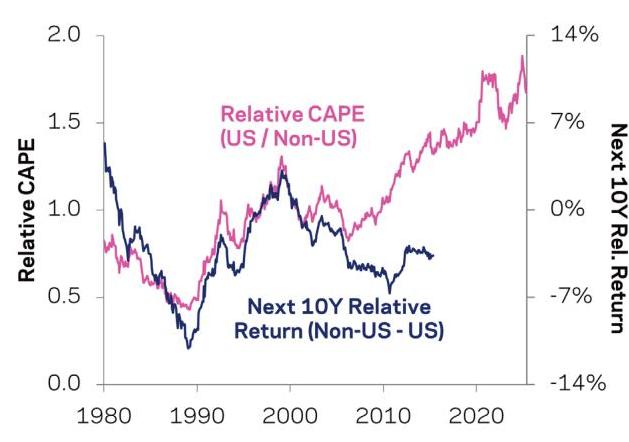
- Chart Evidence:
- The chart below clearly demonstrates the high synchronization between the United States' relative return and its relative valuation (US CAPE / Non-US CAPE), while the contribution from relative real EPS growth is much smaller.
Comparison of US vs. Non-US Real Equity Market Returns and EPS Growth (Cumulative Relative Returns and Valuations)
- Relative valuation (Relative CAPE) shows a significant negative correlation with future 10-year relative returns (the chart here shows Non-US - US returns, thus a positive correlation with US/Non-US CAPE), implying that the current extremely high relative valuation of United States equities foreshadows potential outperformance by non-United States markets in the future.
Relative Valuation vs. Next 10-Year Relative Performance
- Conclusion: Investors' record allocation of 72% to United States equities (MSCI Developed Markets) is typical "rearview-mirror" behavior, mistakenly attributing valuation-driven returns to fundamental drivers, which is particularly dangerous given current extreme valuations. Mean reversion is a more reasonable expectation than further valuation expansion.
3. Behavioral Explanation: Why Are Bond Investors Contrarian While Equity Investors Extrapolate?
The third paper, Why Are Bond Investors Contrarian While Equity Investors Extrapolate?, explores a profound difference from a behavioral finance perspective:
- Bond Investors: Tend to be contrarian thinkers. When interest rates are very low, they expect rates to mean revert (rise).
- Equity Investors: Tend to be extrapolative thinkers. When stock prices rise, they expect them to continue rising.
The report rules out historical patterns (because equity returns historically tend to mean revert, while bond returns tend to persist), proposing a novel explanation: Salience of Information.
- The Salient Information for Bonds is "Yield": This is an intrinsic, forward-looking indicator that directly tells investors the future return if held to maturity. Low yields naturally lead to expectations of low future returns.
- The Salient Information for Equities is "Price and Realized Returns": This is a backward-looking indicator, which easily encourages investors to expect the continuation of past trends.
This difference in information presentation leads to fundamentally different expectation formation patterns for investors in the two asset classes.
4. Historical Perspective: The Evolution of Expected Return Thought
The fourth paper, How Did We Get Here? A Brief History of Expected Returns Formation, traces the evolution of understanding about expected returns within the investment community and academia, providing historical context for AQR's methodology.
- Early Period: Reliance on historical average returns. Jeremy Siegel's Stocks for the Long Run is a typical example, whose emphasis on the 7% long-term real return of United States stocks became deeply ingrained.
- Turning Point (the 2000 dot-com bubble burst): The "lost decade" profoundly taught investors that historical average returns are poor predictors under extreme valuations. This spurred widespread adoption of forward-looking, valuation-based methods (such as CAPE) by practitioners (e.g., CMA providers) and academia.
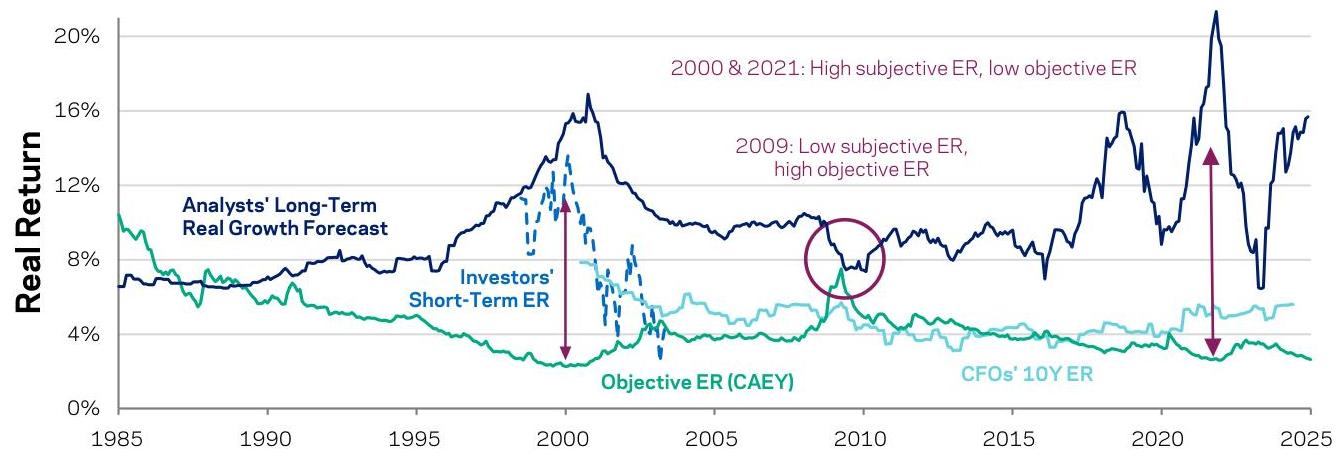
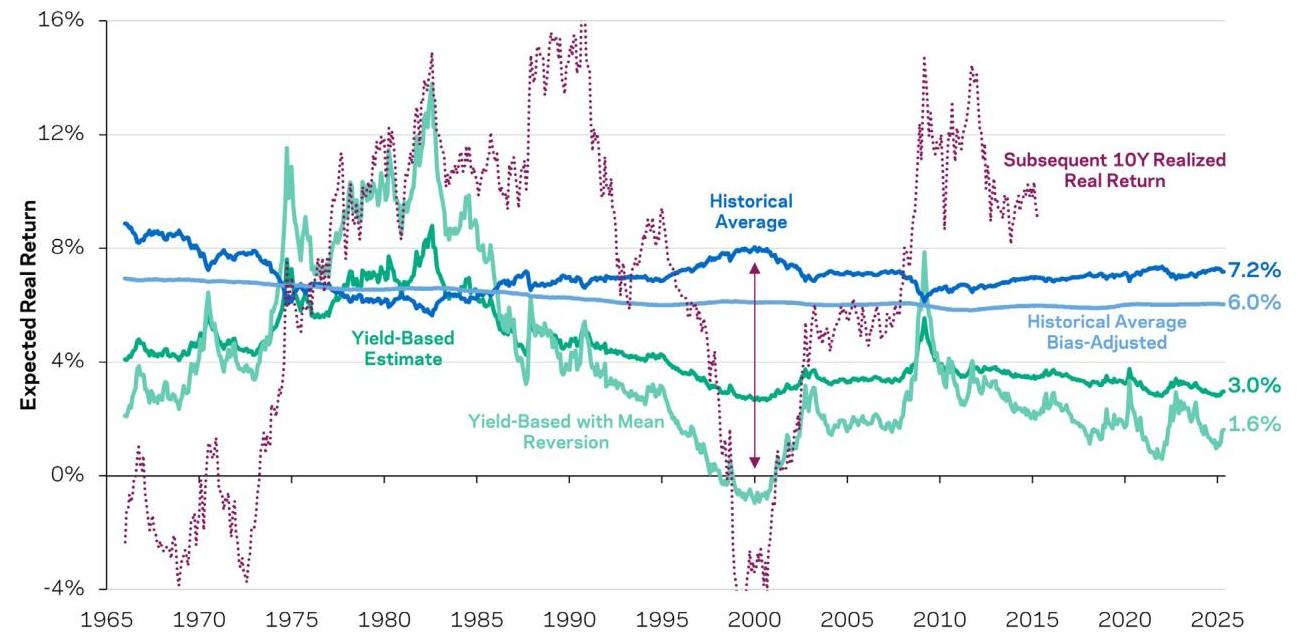
- The chart below visually illustrates this shift in thought:
- In 1999, methods based on historical averages (blue line) yielded optimistic expectations as high as 8%, while yield-based forward-looking methods (green line) gave pessimistic expectations of only 3% (or even negative after considering mean reversion). Hindsight proved the latter to be correct.
Estimated Real Expected Returns for US Equities at Specific Points
- Current Challenge: Although forward-looking methods largely triumphed in the 2000s, their predictive performance was weaker in the 2010s due to sustained valuation expansion, with "rearview-mirror" methods appearing to perform better. This led some investors to lose confidence in forward-looking methods, but AQR firmly believes that despite predictive difficulties, forward-looking methods remain the best starting point.
5. & 6. Data Deep Dive: Deconstructing Historical Returns and Objective Forecasting Models
The final two papers, Equity Market Focus: Interrogating the Historical Data and Equity Market Focus: Objective Expected Returns, delve into the data, providing the strongest quantitative support for the core thesis of the entire series.
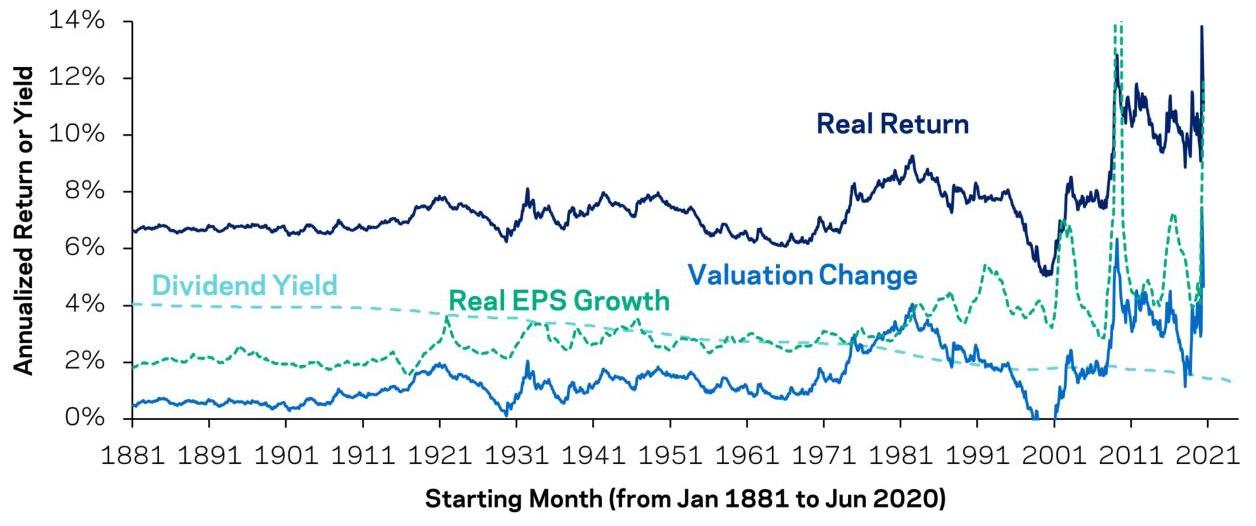
Part 5: Deconstructing the Components of Historical Returns
- Core Formula: Real Return Dividend Yield Real EPS Growth Valuation Change.
- Key Findings:
- Valuation change is the primary driver of recent returns: Between 1982 and 2025, valuation change contributed 4.0% of annualized returns, which is unsustainable.
- Recent earnings growth is unusually high: Nearly 4% real EPS growth since the 21st century is primarily due to one-off factors like declining interest rates and corporate tax rates (Smolyansky (2023)), rather than sustainable productivity improvements. The stable EBIT growth rate (approximately 2%) corroborates this.
- Starting yields are at historical lows: Current high valuations mean dividend yields are far below historical norms.
- The chart below shows the decomposition of returns across different historical periods, clearly illustrating that for more recent samples (e.g., starting from 1982), the blue portion representing Valuation Change is significantly larger.
S&P 500 Real Return Decomposition: Backward-Expanding Averages
Part 6: Evaluating Objective Forecasting Models
- Core Model: CAEY (the inverse of CAPE) is the best objective tool for forecasting multi-year future returns.
- Predictive Power:
- CAPE has a significant negative correlation with future 10-year real returns (correlation −0.51).
- However, the report candidly acknowledges its limitations:
- Small sample size: Few independent 10-year observations, so statistical significance might be overestimated.
- Structural changes: The mean of CAPE has systematically risen after the 1990s, posing a challenge for contrarian investors.
- Ineffective for short-term timing: CAPE provides almost no help in forecasting monthly or quarterly returns.
- The chart below displays the famous CAPE forecasting chart:
Appearances Can Be Deceiving: CAPE vs. Next 10-Year Real Returns
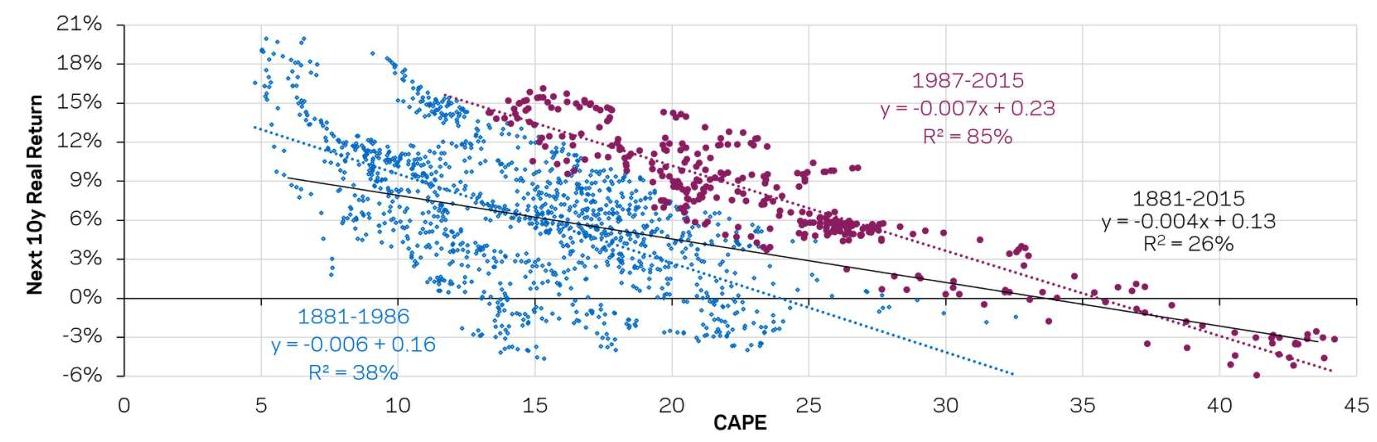
- The report specifically notes that the fit of data points after 1987 (red) is surprisingly high (R² as high as 85%), but this might merely be a coincidence of a few independent data points and should not be overinterpreted.
Summary and Investment Implications
Synthesizing the entire series, AQR constructs a logically rigorous and progressively layered argument:
- Theoretically, forward-looking expectations based on valuation are superior to subjective expectations based on historical extrapolation.
- Practically, the current outperformance of United States equities is a classic trap of rearview-mirror thinking; its high valuation portends lower future returns.
- Psychologically, equity investors are naturally prone to extrapolative errors due to information salience bias.
- Historically, the lessons from 2000 have already demonstrated the value of forward-looking methods.
- Quantitatively, the drivers of recent returns (valuation expansion, anomalous earnings growth) are unsustainable.
The ultimate investment implications are clear:
- Beware of rearview-mirror thinking: Do not be overly optimistic about the future due to strong past 10-year performance, especially when that performance is driven by valuation expansion.
- Emphasize starting valuations: Current high valuations (low CAEY) are the most important signal predicting low long-term future returns.
- Adjust return expectations: Investors should lower their expected returns for future multi-year periods, particularly for United States equities. The historical 7% real return is unlikely to be replicated in the current high-valuation environment.
- Maintain global diversification: Given the extreme valuations in the United States market, maintaining global diversification, rather than going "all-in" on the United States, is a rational choice to spread risk and capture potential mean reversion opportunities.
This report series serves as a powerful antidote to the prevailing optimistic sentiment in the market, reminding investors to return to fundamentals and common sense, and to view long-term investing with a more rational and objective perspective.


