
Nvidia 2Q27 Review: Guidance by Subtraction - NVIDIA's Ceiling Is Set by Supply, Its Margin by Memory
When NVIDIA guides to 70% growth against customer forecasts pointing to a doubling, what is it really telling you about who now sets its growth rate and its gross margin?


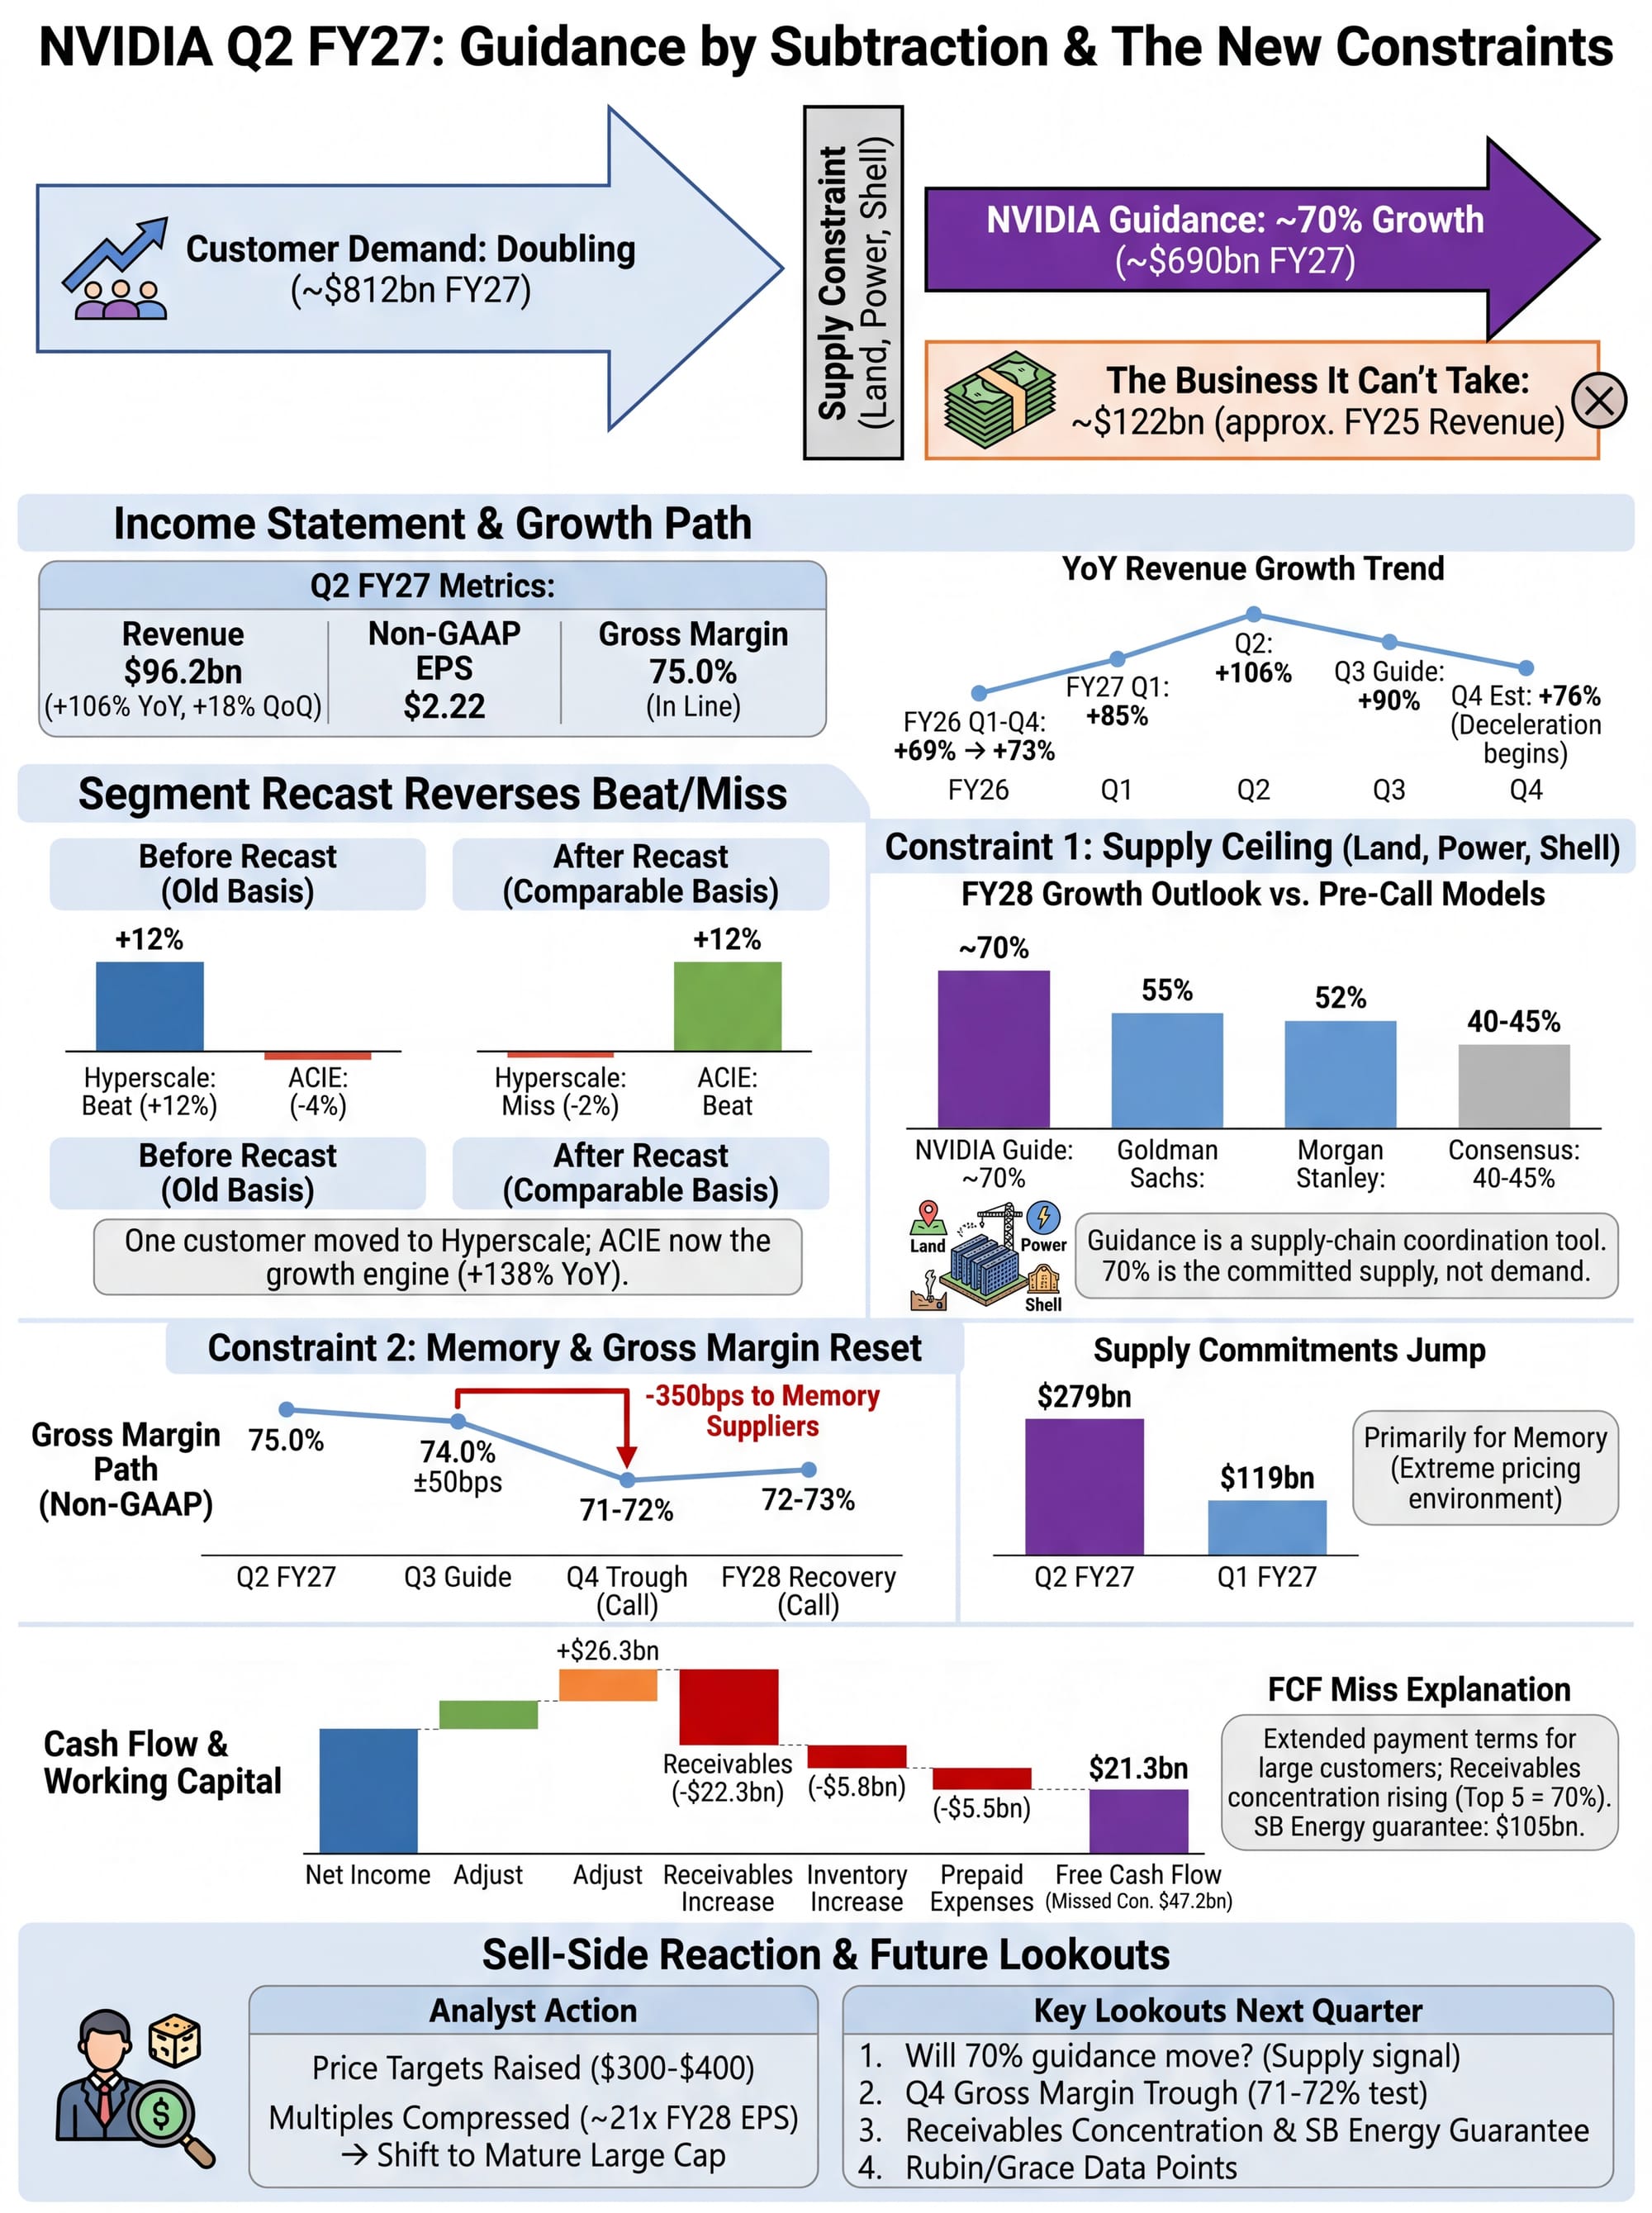
Guidance by Subtraction: NVIDIA Published, a Year Early, the Business It Can't Take
Colette Kress put two numbers into the same passage.
Customer forecasts point to the company's growth doubling next year. NVIDIA's own FY2028 guidance is growth of roughly 70%. She qualified the number in the same breath: "This is a supply-constrained outlook."
The 30 points sitting in between are what this quarter has to explain.
The first half delivered \$177,837mn. Q3 guidance is \$108,000mn. Morgan Stanley's Q4 estimate is \$120,000mn. Add the three and FY2027 lands near \$405,837mn.
Growth of 70% gives \$689,923mn. A doubling gives \$811,674mn. The difference is roughly \$122bn, close to NVIDIA's entire FY2025 revenue of \$130,497mn.
One qualifier belongs right next to that figure. It is my own arithmetic off two numbers the company disclosed, not a contract value NVIDIA published. Generational mix and actual configuration will both move it.
The direction holds either way. This is the first time NVIDIA has put the size of the business it cannot take onto the table a full year ahead. I'll call the practice guidance by subtraction: the number it produces is what remains once the supply constraint has been subtracted from demand.
Three months ago, closing my "NVIDIA 1Q FY27 Earnings Review", I left a base case: the ground actually walked would outrun what's been put on paper. This quarter answered from the other side. The company pushed the paper forward by a full year, out ahead of every sell-side model.
The Income Statement Is the Least Interesting Part of This Quarter
Let me walk the account first, because every judgment below rests on these facts. Revenue of \$96,221mn, YoY +105.85% and QoQ +17.90%, beat Bloomberg BST consensus by 4.26%. Non-GAAP diluted EPS of \$2.22 beat by 6.22%.
Gross margin of 75.0% landed exactly on guidance, and OpEx of \$8,232mn came in 0.82% below it.
A clean beat: revenue ahead, costs in line. None of the five sell-side previews had modelled a miss. The disagreement was never about the print itself.
GAAP P&L Sankey: Hyperscale, ACIE and Edge flow into \$96,221mn of revenue and out to \$59,688mn of net income
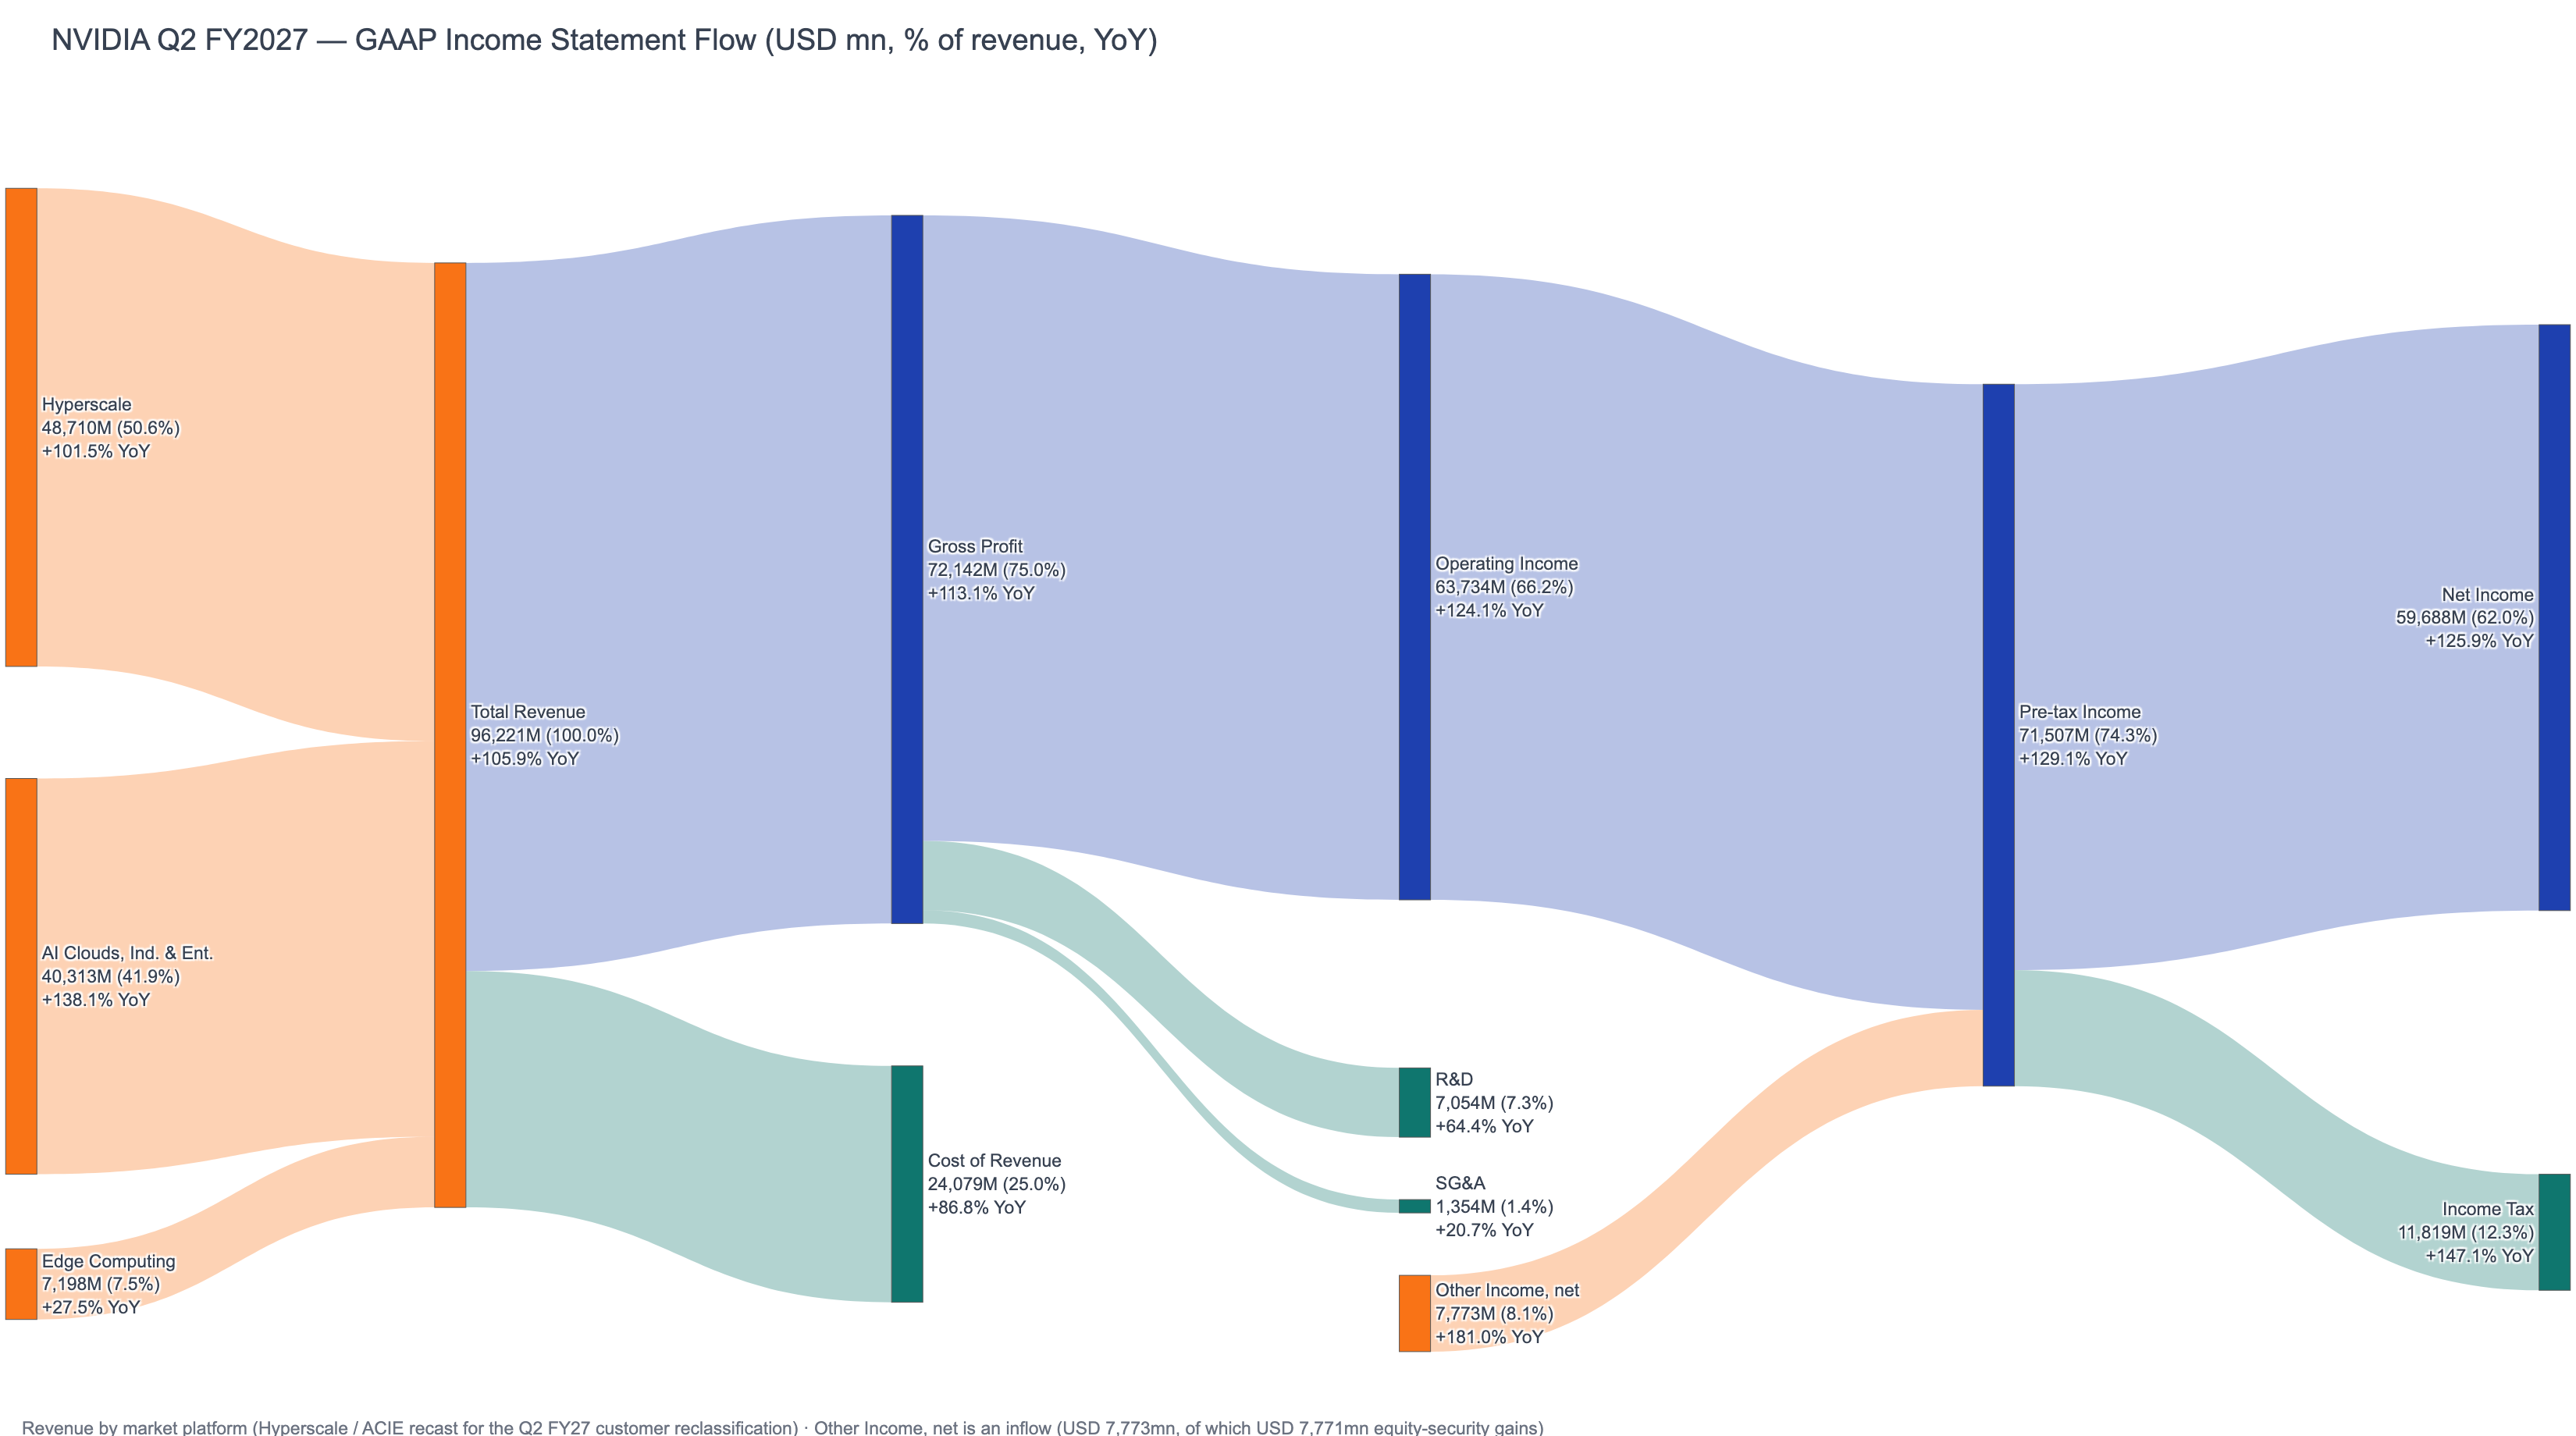
Source: Author's own chart based on NVIDIA 2Q FY27 reported financials. The orange Other Income node is an inflow, of which \$7,771mn is the equity-security fair-value gain, already excluded from Non-GAAP.
The shape of the YoY growth rate is the one thing in this chart to pull out separately.
FY2026's four quarters grew +69.2%, +55.6%, +62.5% and +73.2%. FY2027 opened at +85.2%, then +105.9%. Management put it this way in the deck: a fourth consecutive quarter of accelerating year-on-year growth, unprecedented at the company's current operating scale.
Q3 guidance implies +89.5%. Q4, on Morgan Stanley's estimate, implies +76.1%. The acceleration ends here.
Quarterly revenue and YoY growth, 1Q FY25 through 4Q FY27E
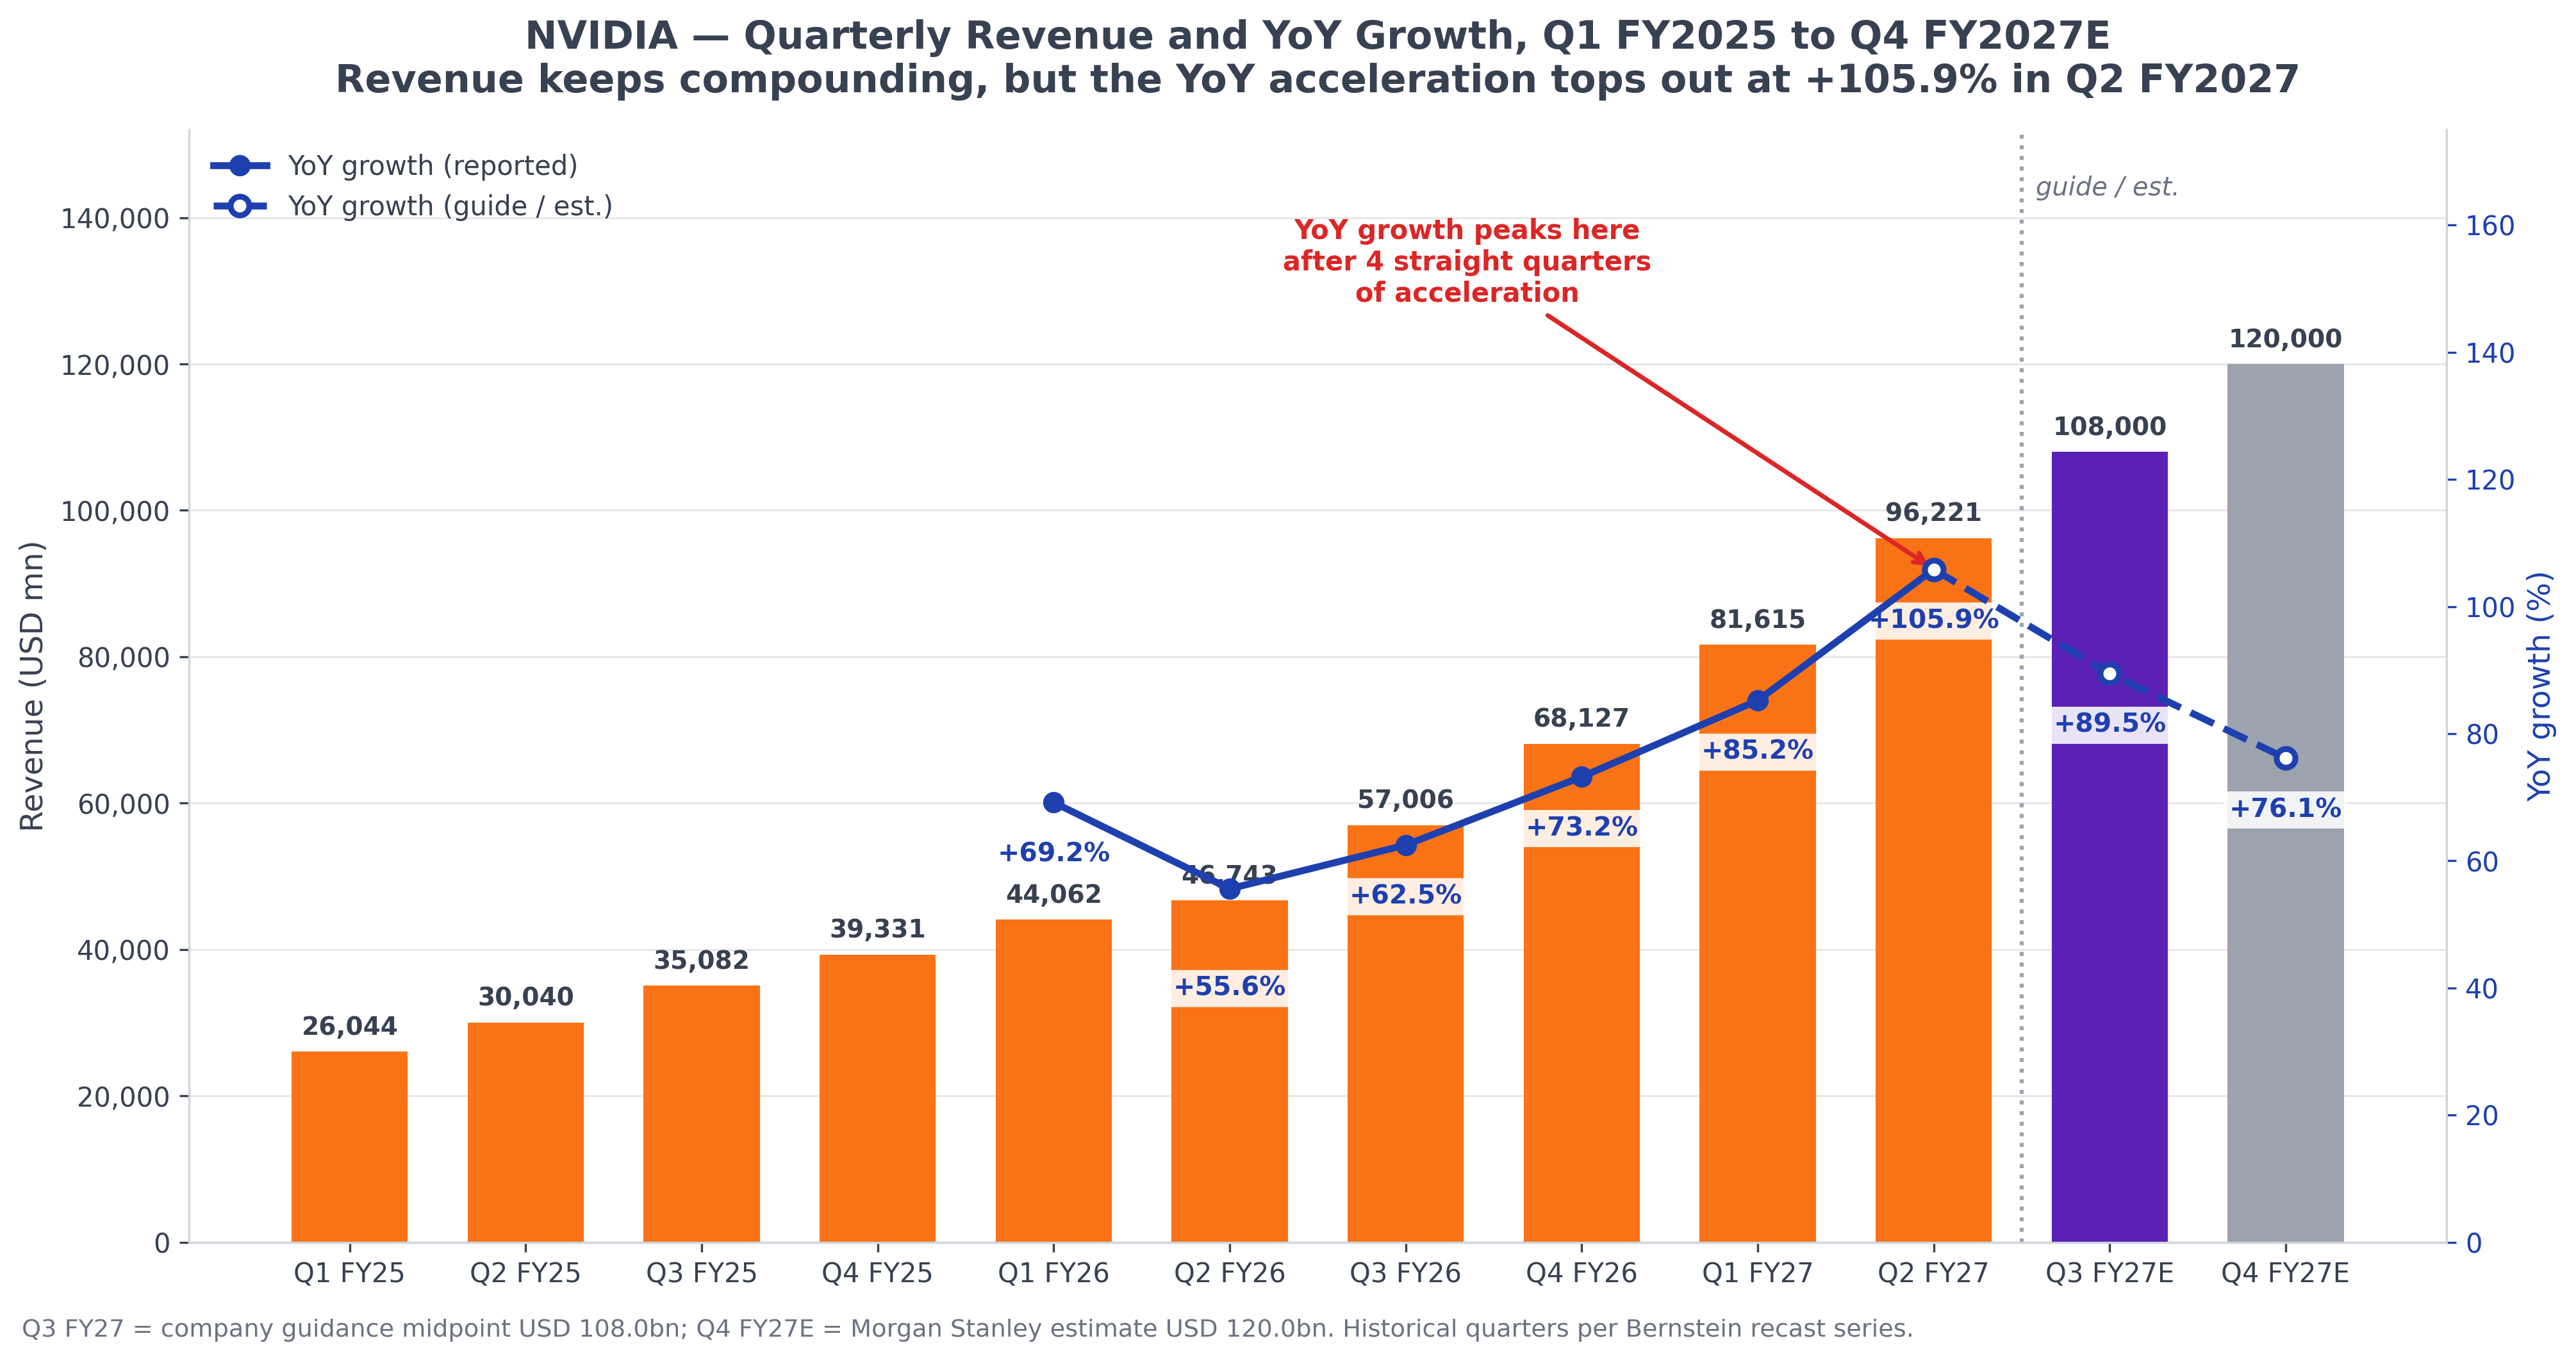
Source: Author's own chart. Historical quarters from Bernstein's recast series. 3Q FY27 is the company guidance midpoint and 4Q FY27E is the Morgan Stanley estimate.
Two qualifiers travel with that conclusion. The deceleration comes from the rising base, and Q3's sequential dollar increment is still \$11,779mn. Beyond that, Q4 FY2027 runs 14 weeks against 13 in Q4 FY2026, so the unadjusted +76.1% already carries an extra week of tailwind.
Across the four post-print reports, none wrote out this growth path.
One Segment Line That Got Read Backwards
NVIDIA moved one customer from ACIE to Hyperscale this quarter and recast the prior-period revenue. BST consensus still sits on the old basis.
So the surface numbers show Hyperscale beating by 11.85% and ACIE missing by 3.93%. Restated on a comparable basis, Hyperscale misses by 1.62% and ACIE beats by 11.53%. The direction flips.
Segment beat and miss, before and after the recast
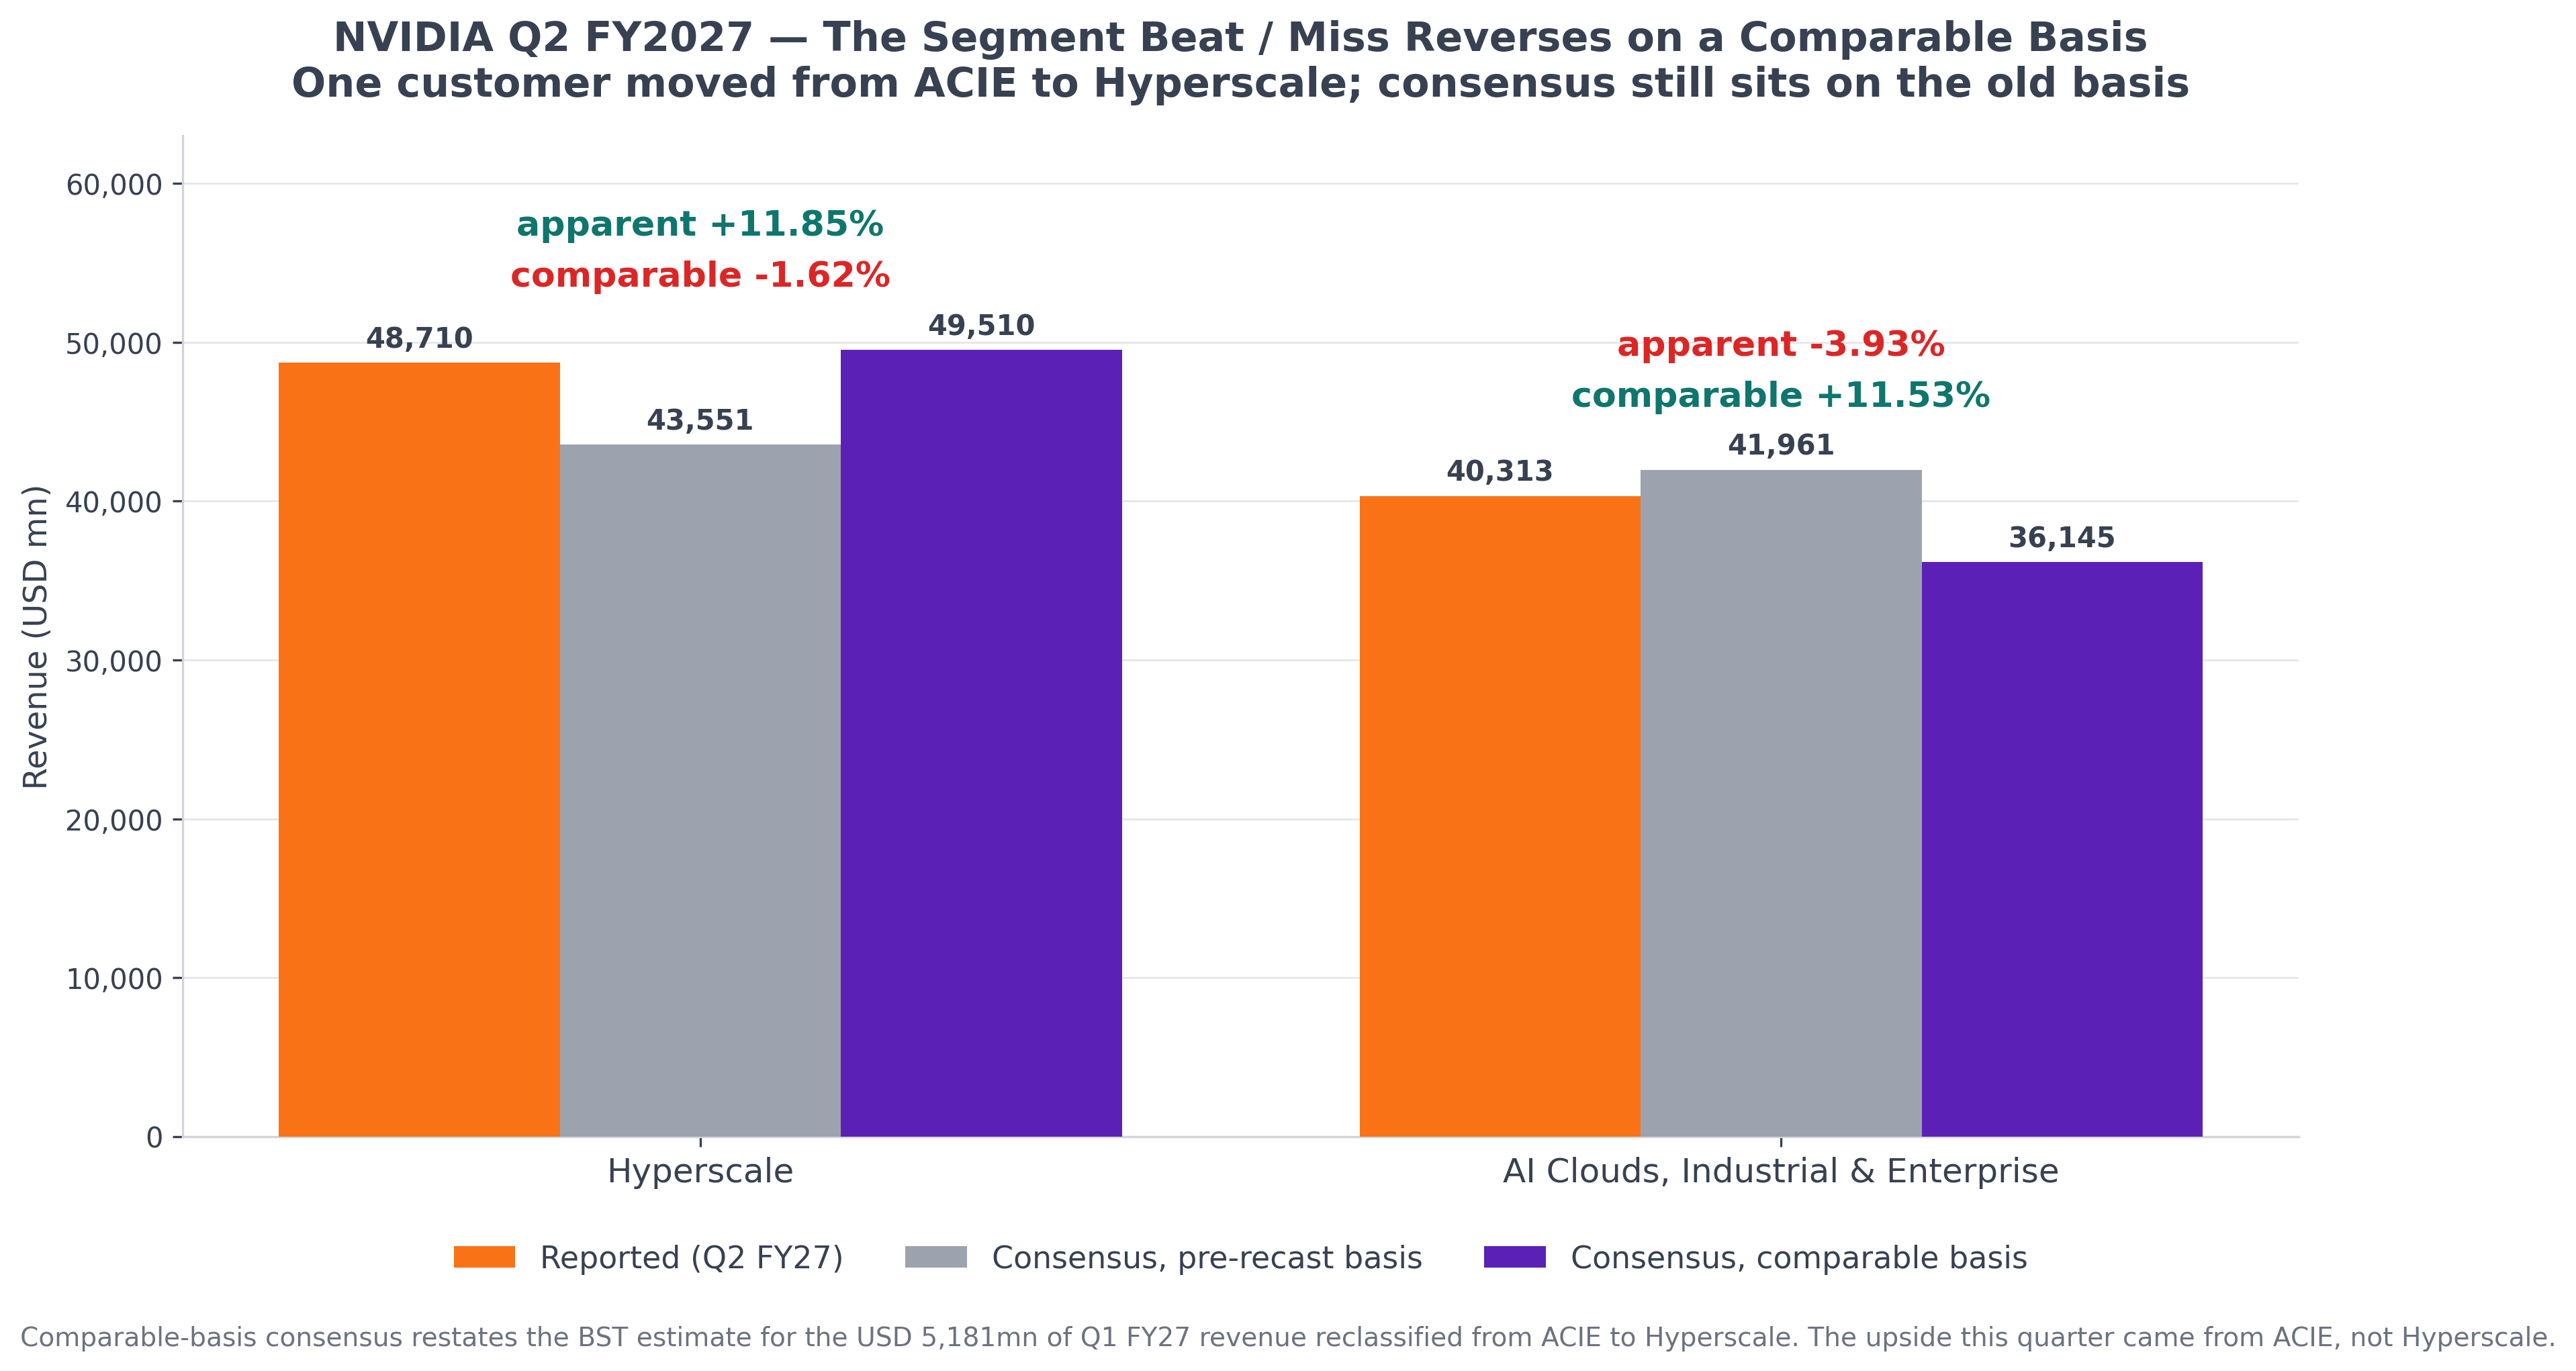
Source: Author's own chart. The comparable-basis consensus restates the BST estimate for the roughly \$5,181mn of 1Q FY27 revenue that was reclassified.
BofA Securities carried the old basis straight into its results table. It listed Hyperscale as a 12% beat and ACIE as a 4% miss, and described the segment as running slightly below expectations.
Bernstein was the only house to write the reclassification into its body text, though its comparison table stops at the Data Center and Edge level. Goldman Sachs and Morgan Stanley reported growth rates without beat and miss, and so happened to sidestep it.
The practical implication is this. NVIDIA changed its presentation basis twice inside a year, so any cross-quarter segment series has to be pulled fresh. Carrying an old model forward produces a conclusion pointing the wrong way.
Restated, the growth engine this quarter is ACIE, YoY +138.14% and QoQ +25.21%. Jensen Huang's description of that business: "That part of the world is invisible to everybody."
It covers sovereign AI, regional neoclouds, AI startups and enterprise customers. Together they account for roughly half of the company's business and grow at 100% a year.
The First Yardstick: The Growth Ceiling Now Sits With Land, Power and Shell
Four analysts pushed on the 70% during Q&A, and Jensen Huang's framing tightened each time.
To Joseph Moore, he said demand runs well above 70% while supply only lets the company commit to 70% with confidence. To Stacy Rasgon, he stressed the scale of the supply chain three sentences running, said a great deal of supply was already locked, "but we just need more." By the time Jim Schneider asked, he corrected himself mid-answer: "at this moment, we have supply for 70%. We have more supply than 70%, but about 70%."
The FY2028 growth outlook against every pre-call model
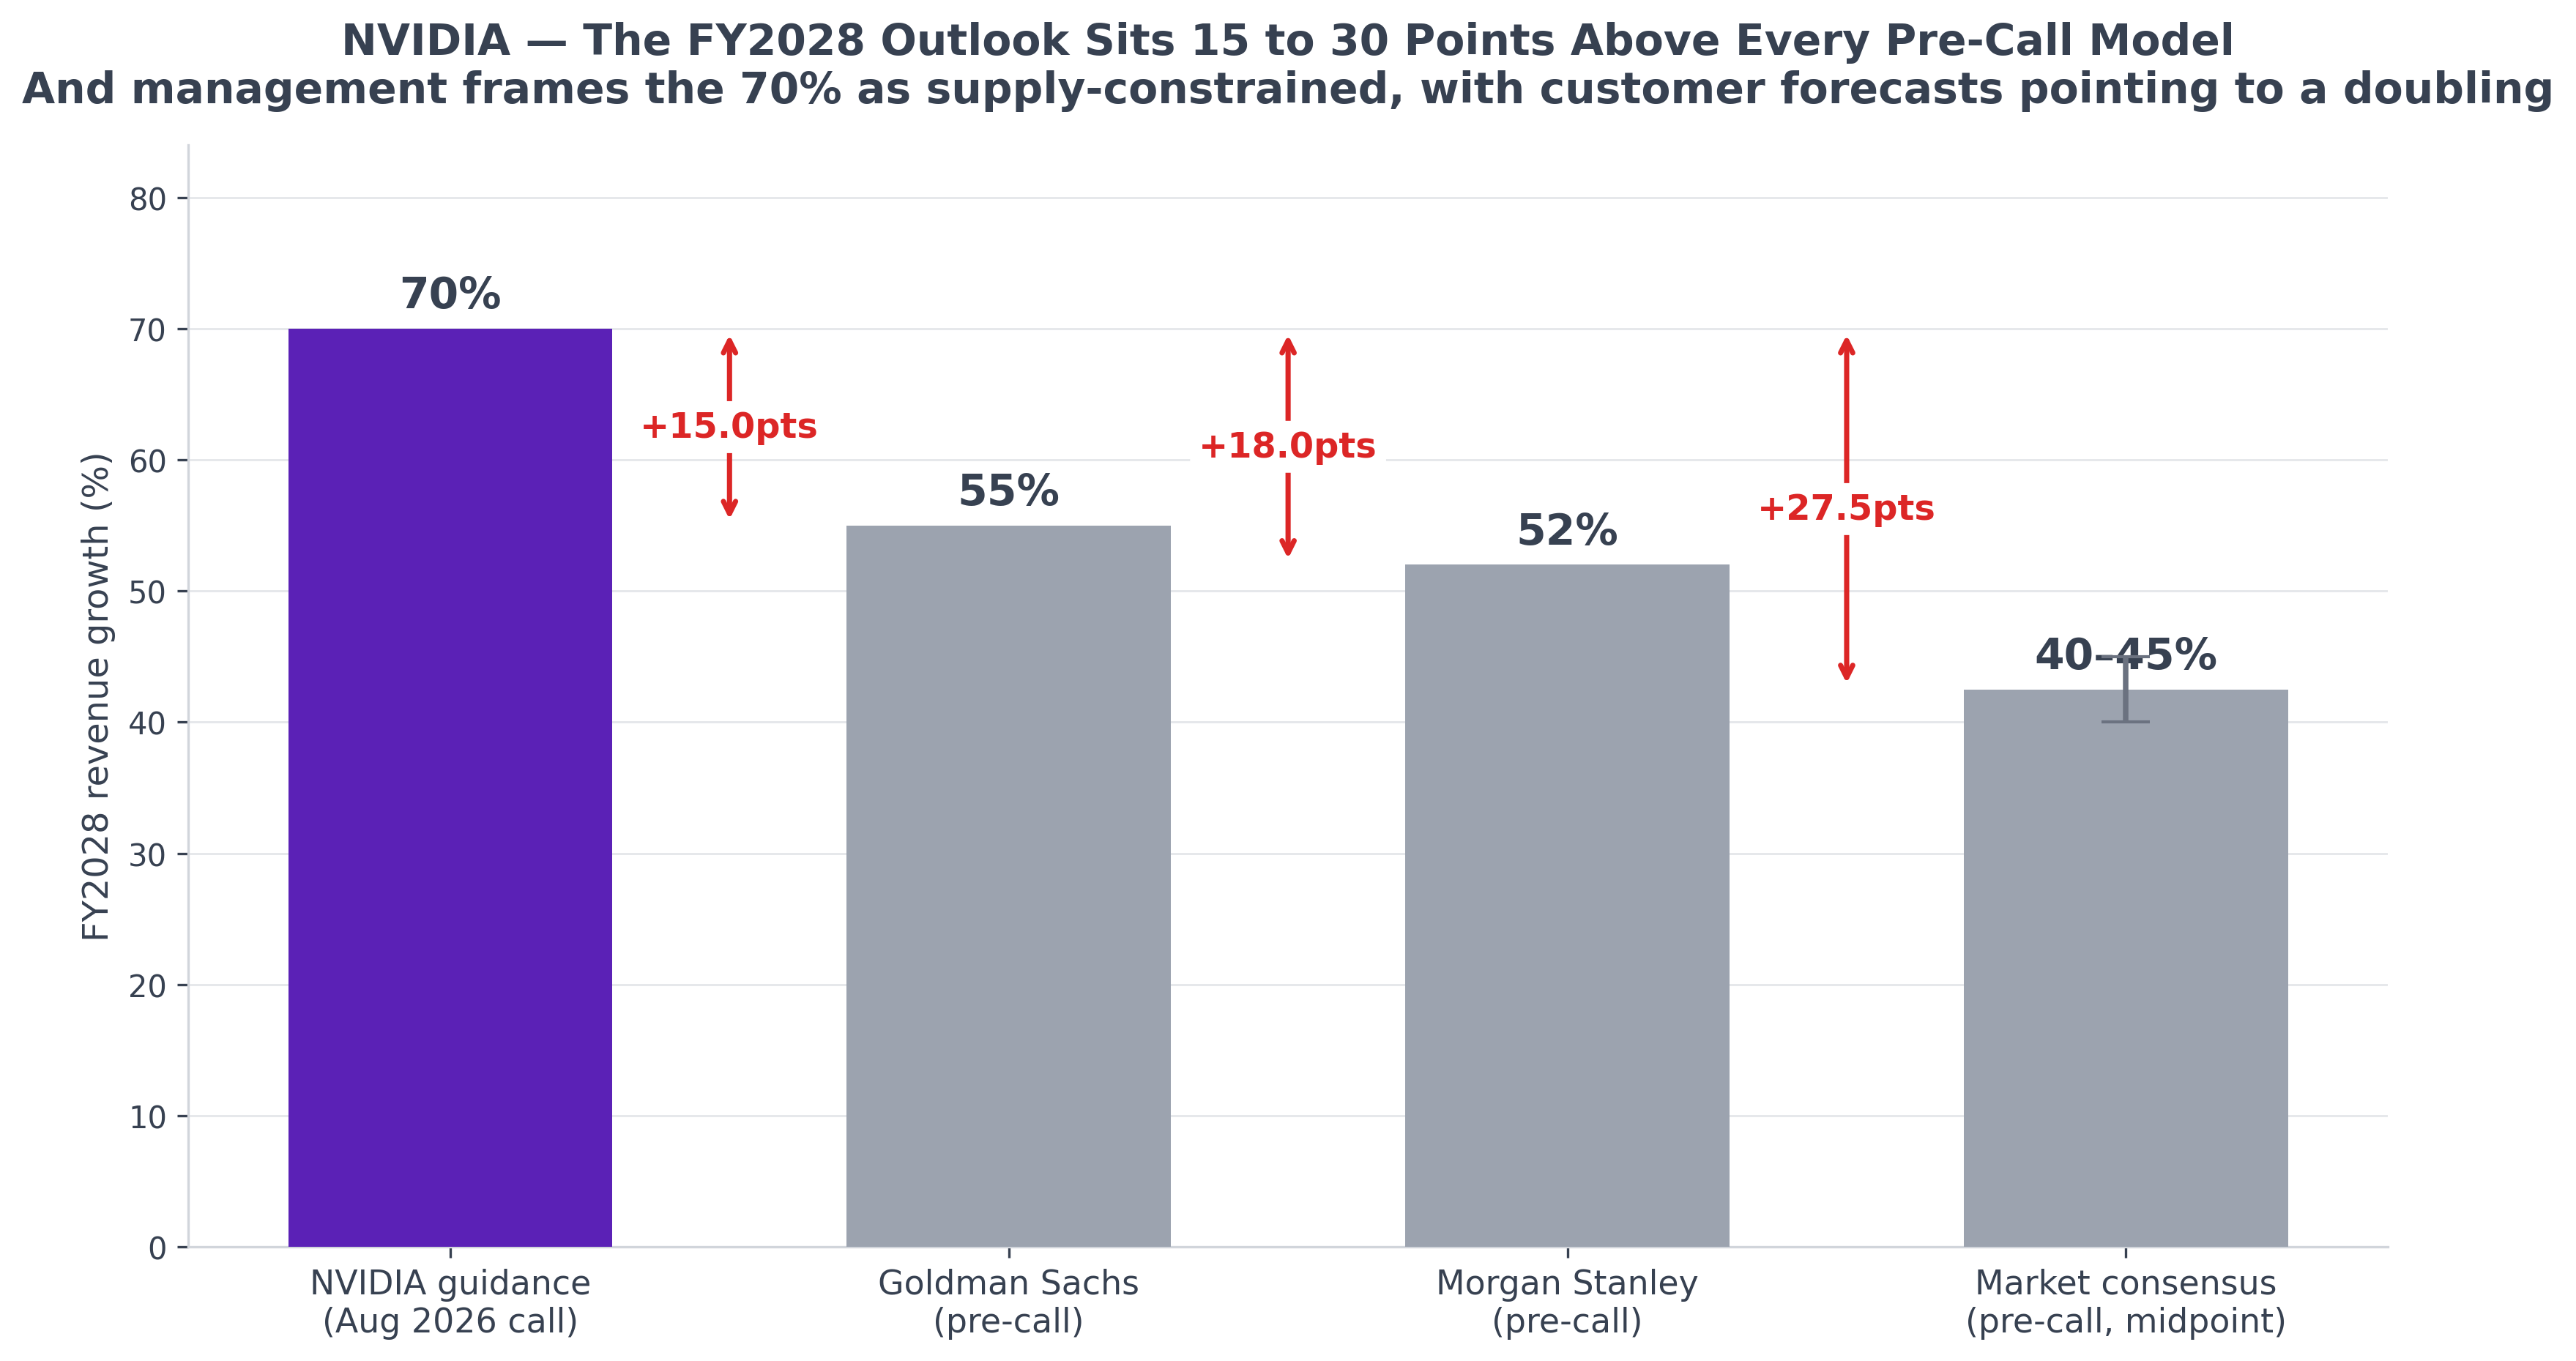
Source: Author's own chart. Pre-call assumptions as restated by each house in its own post-print report.
The location of the constraint got spelled out too. You can no longer simply procure the technology and stand the infrastructure up. Land, power and shell have to be secured first, and those often run 2 to 3 years ahead. Jensen Huang reached for an old example to explain the value of moving early: a long time ago, people asked why a chip company was bothering to work with memory suppliers.
The motive for guiding a year out was stated plainly. Customers, shareholders and the supply chain are all committing large resources, and the company wants every party working off the same information. "Everybody's on the exact same song sheet."
That sentence changes what this guidance is. It doubles as a supply-chain coordination document, which means any future revision to the 70% is simultaneously a revision to production plans upstream.
Here is where I would keep some doubt. All four houses accepted the premise that 70% is a function of supply rather than demand, and none of them tested it.
If 70% is set purely by supply, any improvement on the supply side should flow straight through to revenue. If it carries a reserve against demand, improvement will not convert proportionally. This set of materials cannot separate the two.
Given that the company is using the guidance as a coordination tool, I lean toward the reserve being thin. A number you take to your suppliers is more expensive to pad than one you read out on an earnings call. Whether that reasoning holds will show up in how the next guide moves.
Jensen Huang declined to rank the bottlenecks. Jim Schneider asked him to put data center power and shell, DRAM, and foundry capacity in order.
He opened with a refusal: "There's something funny I could say, but I'm going to just not." Then he explained the reticence with a joke. One of the most entertaining things last year, he said, was working out where to go for dinner and who to have dinner with, and watching that stock double the next day.
The Second Yardstick: Three Memory Makers Now Write This P&L
The written materials gave one quarter of gross margin. The call gave the whole curve. 75.0% this quarter, Q3 guided to 74.0% ±50bps, a Q4 trough at 71% to 72%, then FY2028 back to 72% to 73%. The Q4 midpoint sits 350bps below this quarter, and FY2028 recovers only 100bps of it.
The gross margin path reset, against the sell side's pre-call 75.1% assumption for FY2028
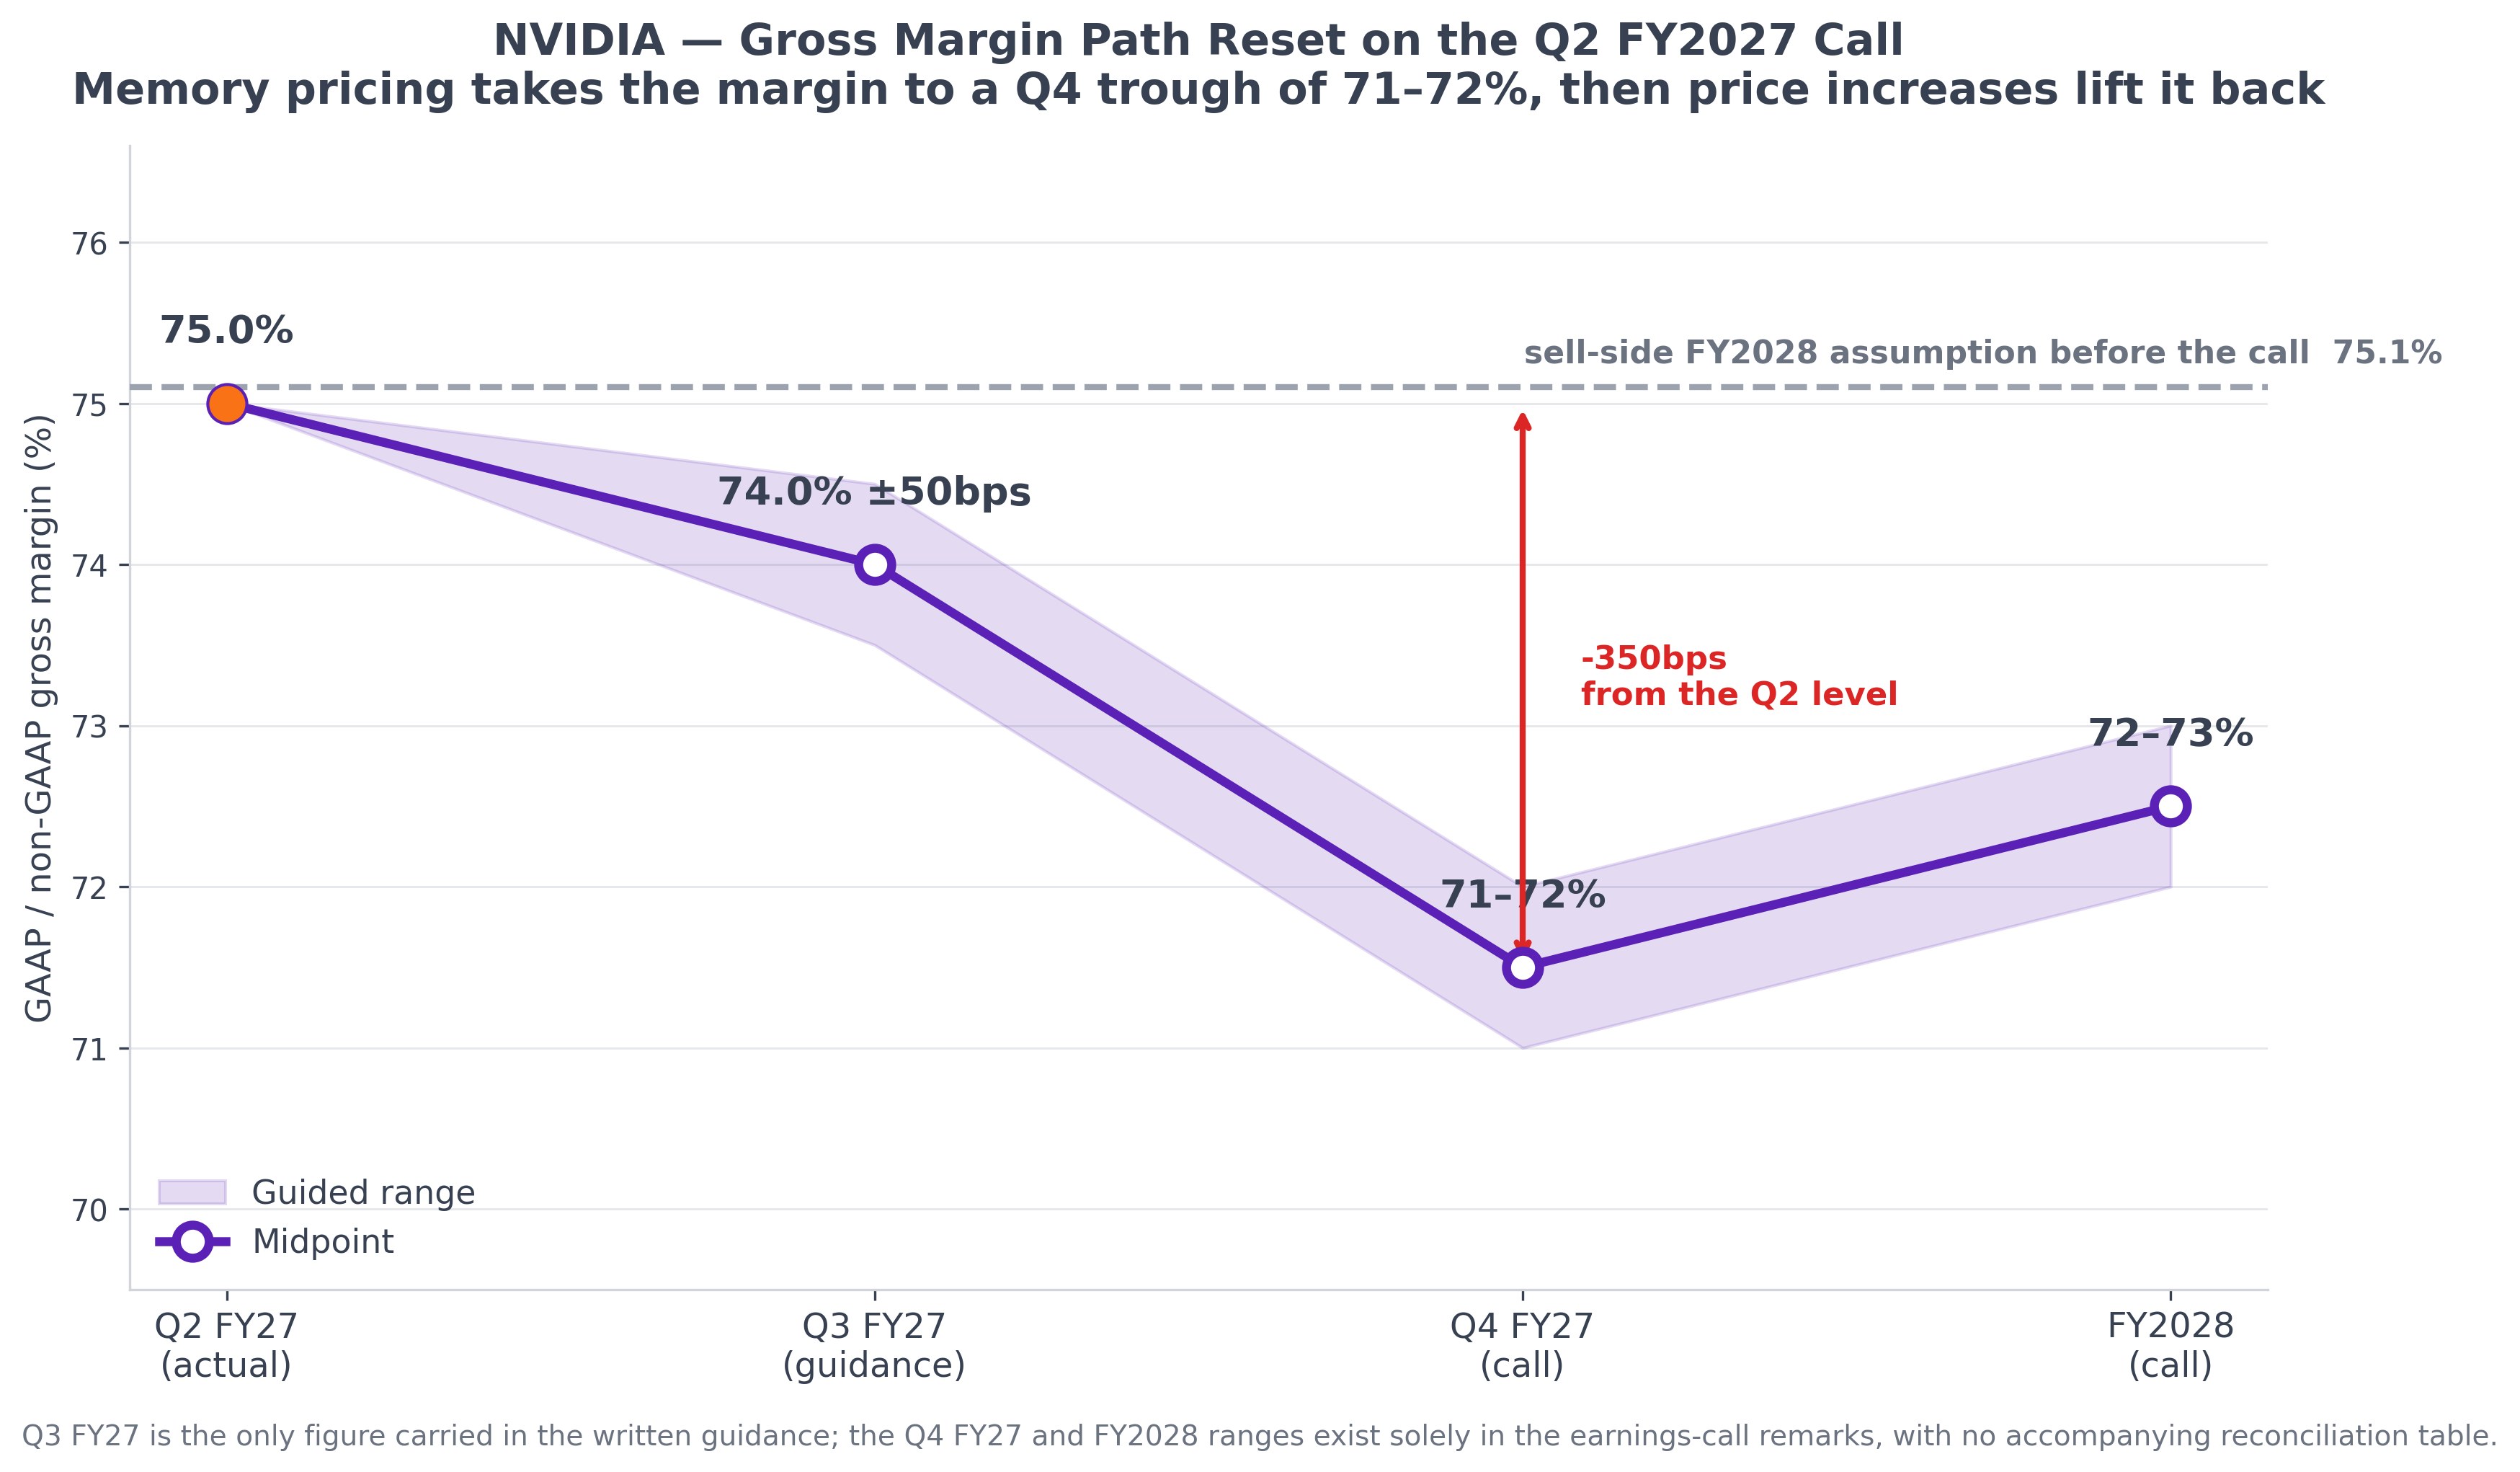
Source: Author's own chart. Q3 is the only figure carried in written guidance. The Q4 and FY2028 ranges exist solely in the earnings call remarks, with no reconciliation table behind them.
Neither the press release nor the CFO Commentary explained the 100bps cut to Q3. The call supplied the attribution: memory is in an extreme pricing environment, running beyond what the company had expected, and heading higher again next year.
Two independent traces on the balance sheet point at the same thing. Supply and capacity commitments jumped from \$119bn to \$279bn in a single quarter, which Colette Kress tied explicitly to memory purchases, and raw material inventory rose 198% YoY. Add the \$31.6bn of inventory on the books and NVIDIA has roughly \$310.6bn locked into its supply chain, about 2.9 times this quarter's annualised cost of revenue.
NVIDIA total supply-related commitments by quarter
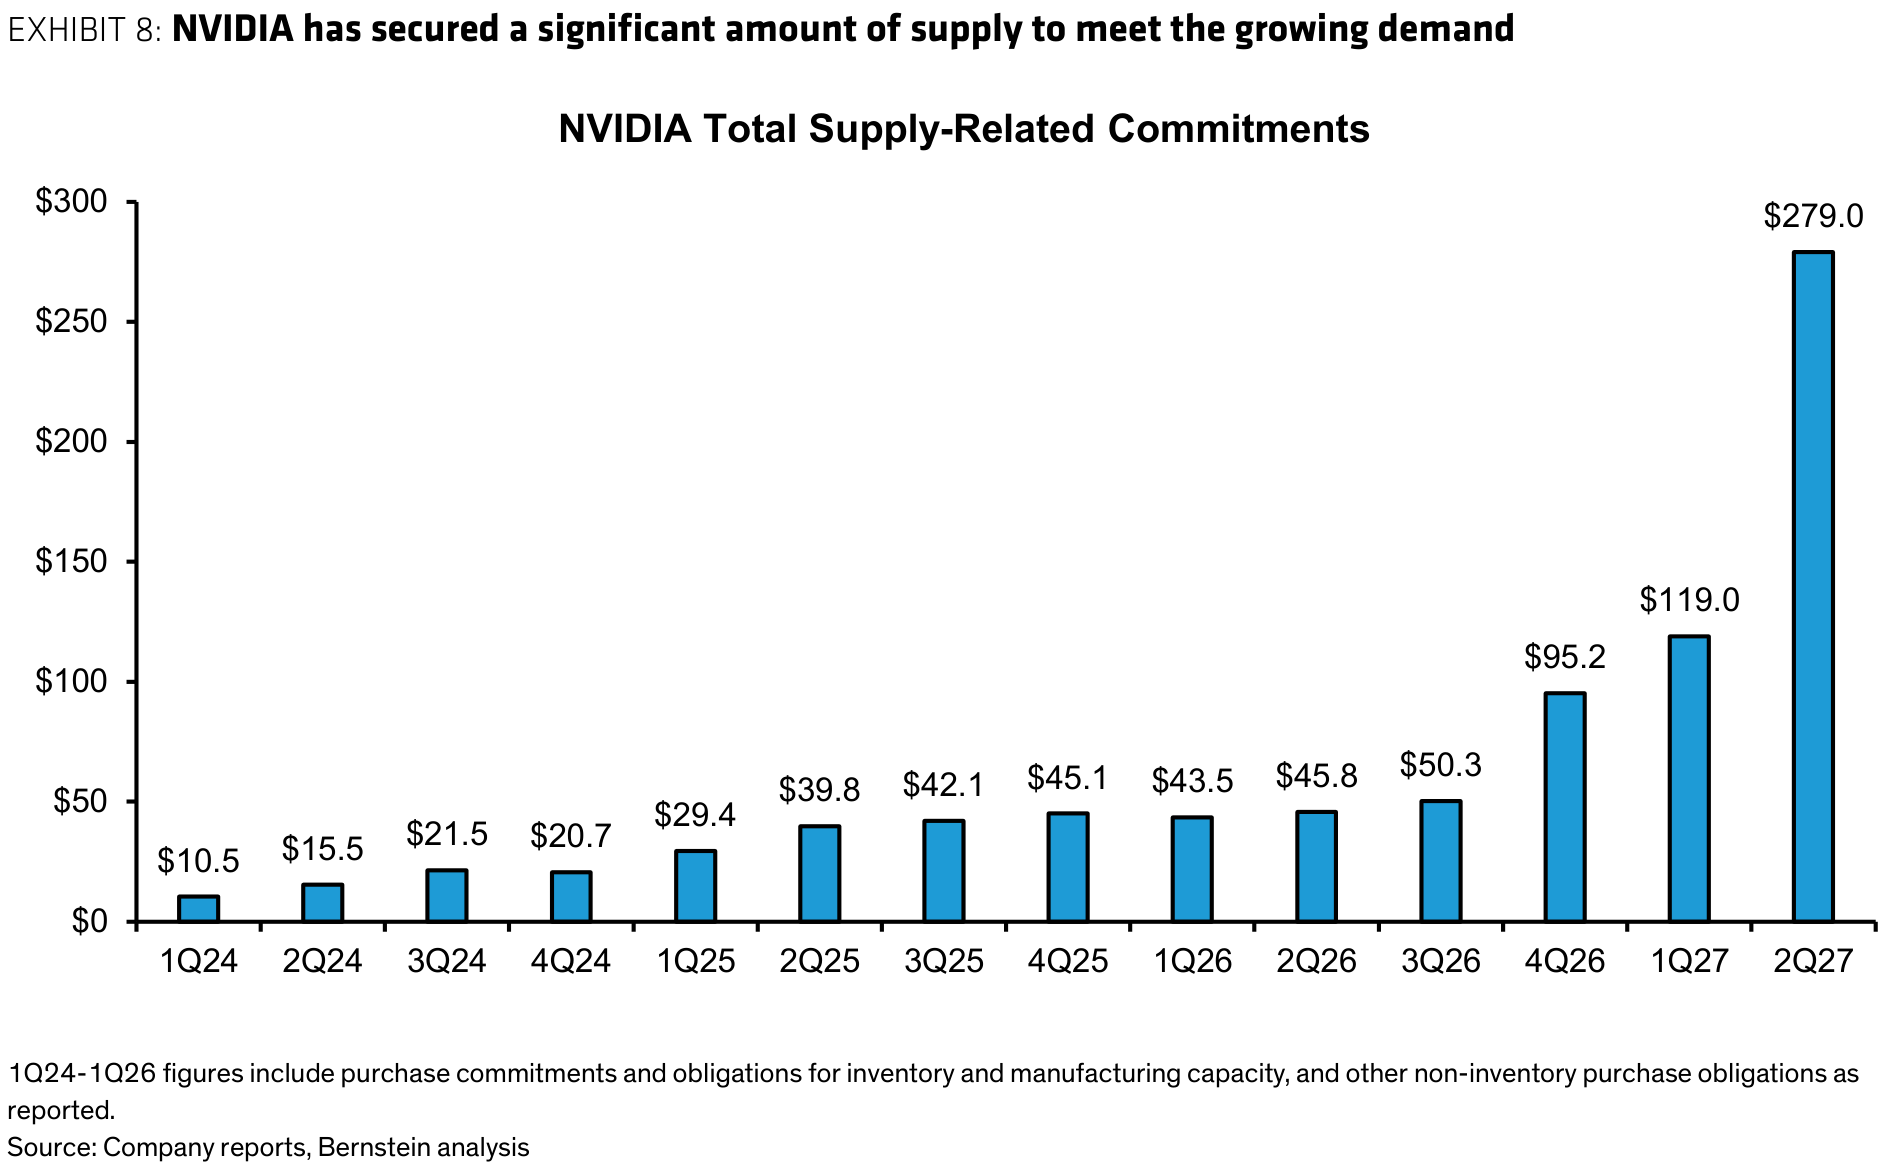
Source: Bernstein, NVDA FQ227 recap (August 2026). From \$10.5bn in 1Q24 to \$279.0bn this quarter.
I wrote in the 4Q26 review that if the income statement captures now, purchase commitments capture what management thinks about tomorrow. This quarter that judgment more than doubled in size.
Here I need to correct something I argued in the pre-print preview. My view then was that the gross margin was holding because NVIDIA was actively de-speccing memory. Three traces supported it: HBM configurations cut by as much as 50%, a low-LPDDR Vera CPU, and the 192GB HBM4 8-Hi option on Rubin Ultra.
This quarter the company locked \$279bn of memory purchases in one move, pointing the opposite way from cutting usage.
Lower per-unit configuration and higher total purchasing can both be true when unit shipments are climbing fast, so the two need not contradict. But a 350bps drawdown in gross margin says de-spec and volume-locking were partial hedges at best. The final hedge is raising prices to customers, and those increases have already been executed, effective from Q1 FY2028.
The question I posed in the preview, whether the gross margin resilience was structural or borrowed, now sits on the borrowed side.
All four houses read the reset the same way, as the bad news clearing. That unanimity is the part I would question, so let me set the four reasons out separately.
Morgan Stanley's version is the sturdiest. Memory cost is being passed through, so the percentage falls while gross profit dollars keep rising. And 72% to 73% matches its prior 72.5% assumption, making it the only one of the four that had already modelled the cut.
BofA supplies a mechanism: pricing across nearly \$300bn of memory supply commitments is largely fixed, which limits further downside. Goldman Sachs frames it as a clearing event. Bernstein reads it as proof of margin management.
The qualifier those four reasons need comes from Morgan Stanley's own arithmetic. Commitments falling within the remaining FY27 to FY28 window total \$179bn, against \$252bn of modelled cost of revenue for the same period, a coverage ratio of 71.0%. That ratio says the quantity of cost is locked. It says nothing about the level at which it was locked.
If the locking happened after the price increase, 71% coverage guarantees "no worse." It does not guarantee "better." Which fits the path exactly: a Q4 trough, with only 100bps recovered in FY2028.
The 250 to 350bps NVIDIA gave up did not disappear. It moved to the memory suppliers. BofA flagged the read-across to the memory industry and to Micron explicitly.
That thread has already run part of its course in two other pieces of mine. In "ASML 2Q26 Earnings Review", the Memory segment was guided to +75% revenue growth for FY26, and the CEO declined to split HBM from DDR, explaining that customers are optimising between the two because "the DDR price point is very strong right now."
In "Every Roadblock Cleared, Now What", I planted a line: Apple's carried-over low-cost memory inventory would run out, and the pressure would surface quarter by quarter.
The same suppliers are now writing two income statements at once. One belongs to the most profitable consumer hardware company in the world. The other belongs to the most profitable AI infrastructure company in the world.
The two responses differ. NVIDIA can raise prices, and has. Apple faces a product line priced by model on a fixed refresh cycle, where the same move is far harder.
That difference is what separates the top of an AI value chain from the top of a consumer electronics one.
The Third Thing: The Cash Is Flowing Toward the Same People It Sells To
Free cash flow of \$21,341mn came in 54.78% below the \$47,191mn consensus. It is the only deviation of any magnitude this quarter.
The cause sits entirely in working capital. Receivables rose \$22,346mn in the quarter, inventory \$5,784mn, prepaid expenses \$5,497mn.
DSO went from the 47.71 days implied by consensus to 60 days. The portion of receivables above the consensus-implied level explains 48.8% of the gap on its own. Add inventory and it reaches 60.0%; add prepaid expenses and it reaches 81.3%.
From net income to free cash flow
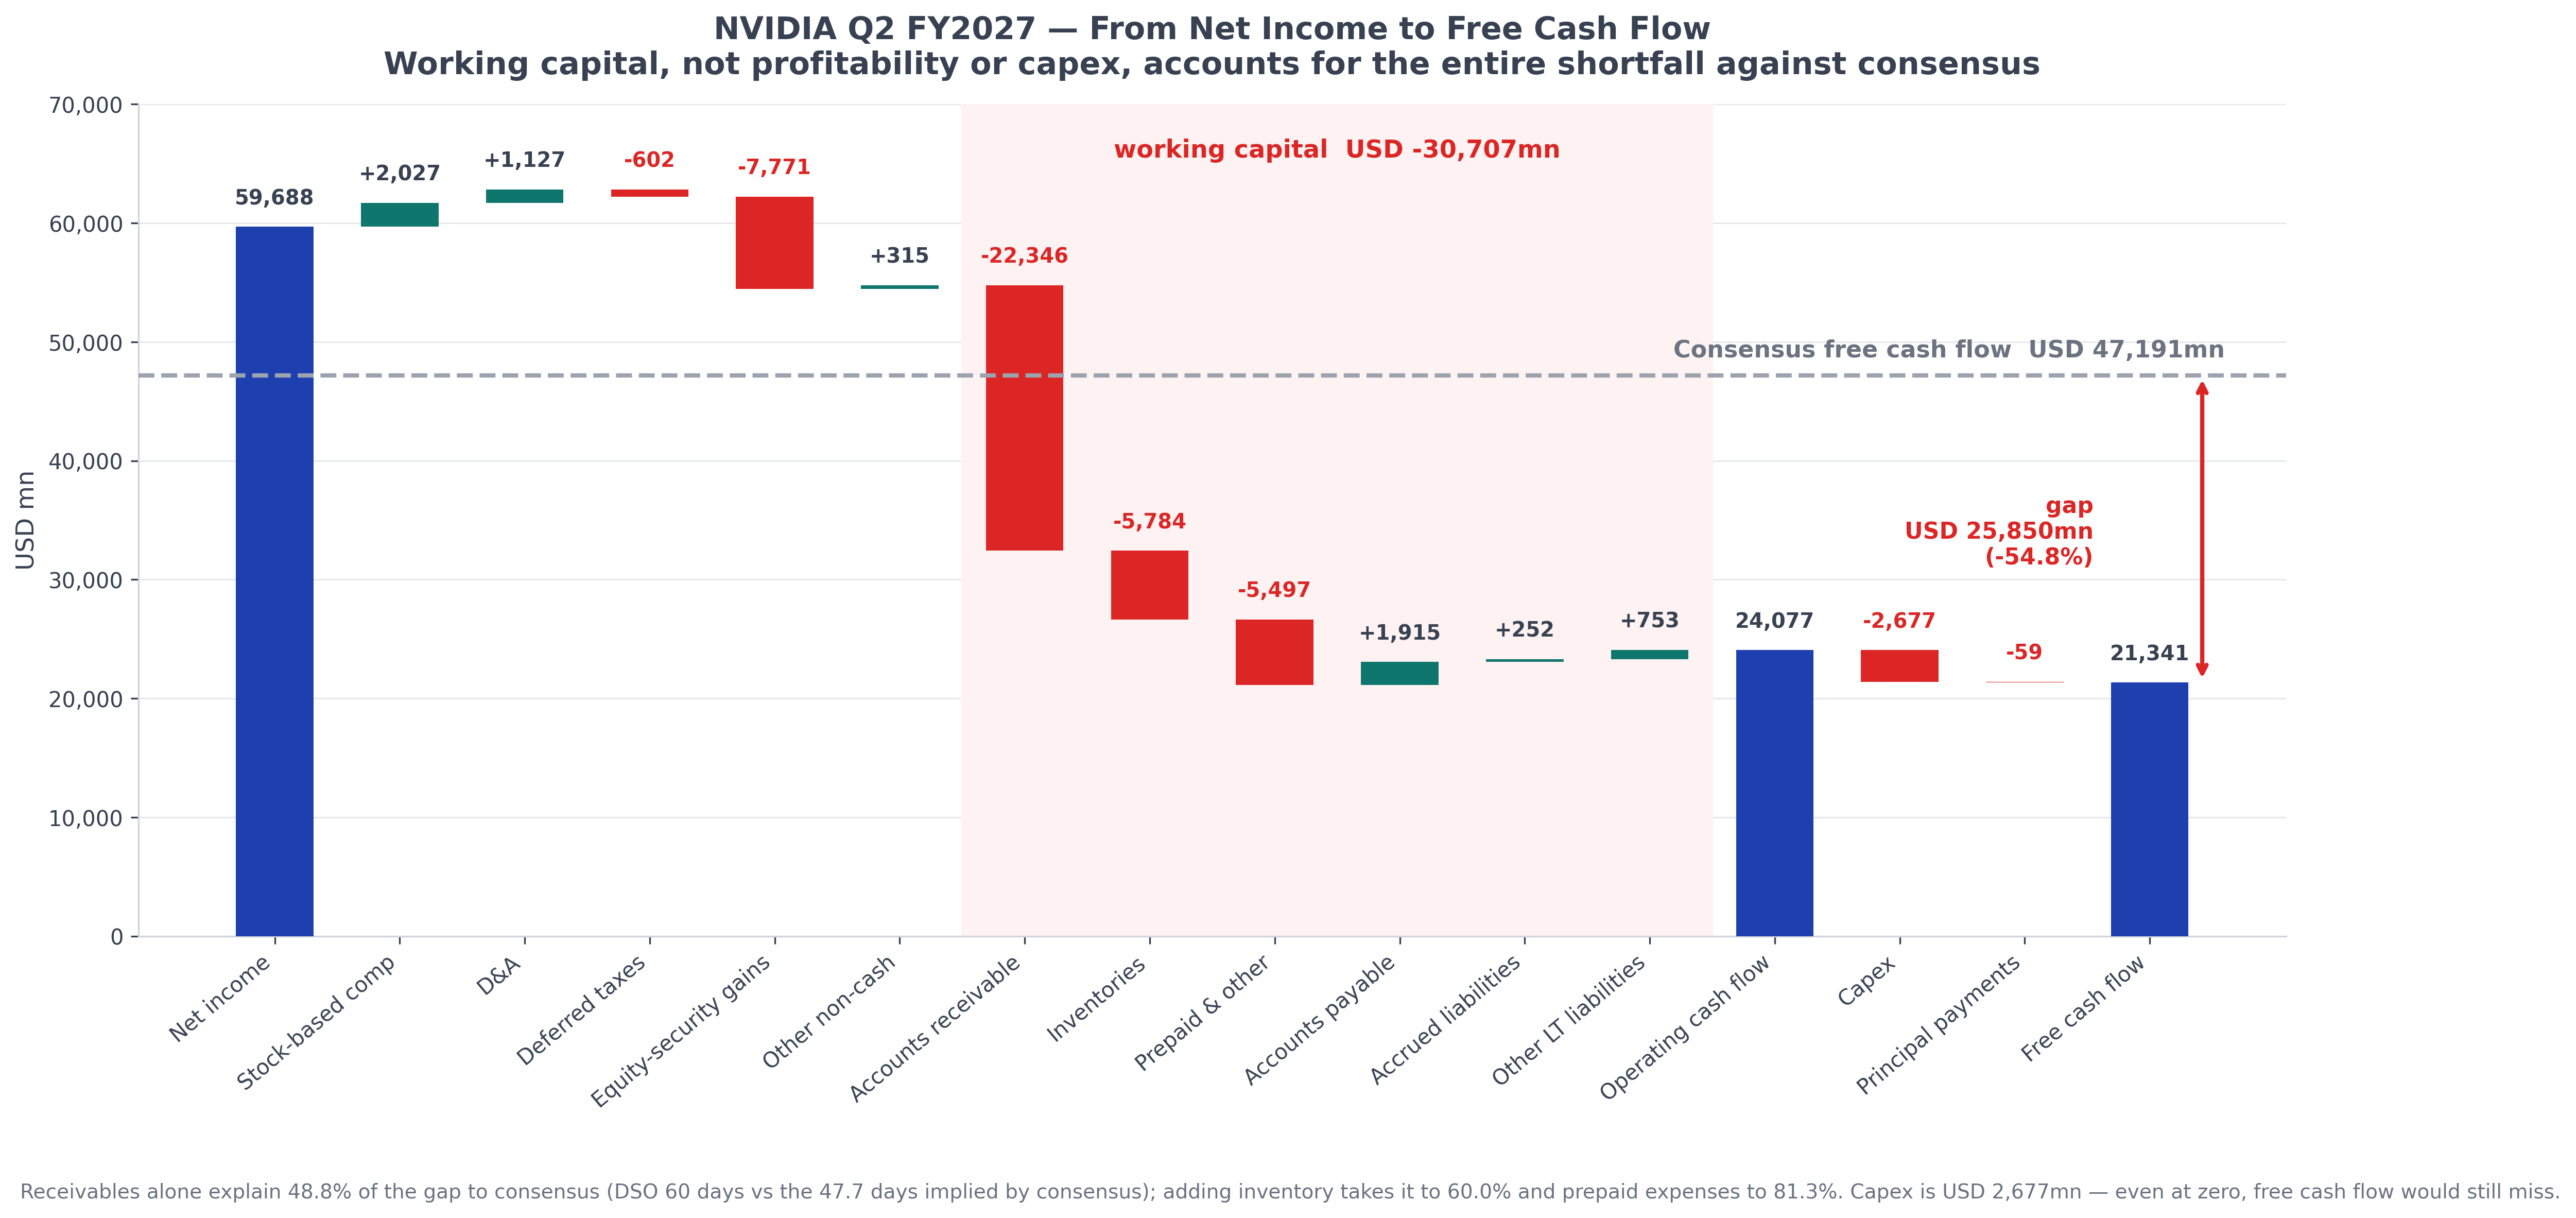
Source: Author's own chart based on NVIDIA's 2Q FY27 cash flow statement. The pink band is the working capital block, totalling -\$30,707mn.
Capex is not the cause. It ran \$2,677mn this quarter, and even at zero, free cash flow would be \$24,077mn, still far short of consensus.
The explanation given on the call: certain investment-grade customers negotiated extended payment terms on large purchases delivered across several quarters.
The other side of the argument holds too. First-half free cash flow was \$69,895mn, +76.6% YoY, at a 39.3% margin. On a half-year basis it stays strong, and only the single-quarter view shows a break, which reads like timing. But payment terms are contract terms, not accounting estimates, so the effect carries into the quarters ahead.
Three other facts from the same period need reading alongside it.
The company returned \$25,721mn to shareholders, 120.5% of the quarter's free cash flow. Add \$15,822mn of equity investments and the total reaches 1.95 times free cash flow. The gap was closed by \$25.0bn of senior notes issued in June.
Balance sheet composition, six months apart
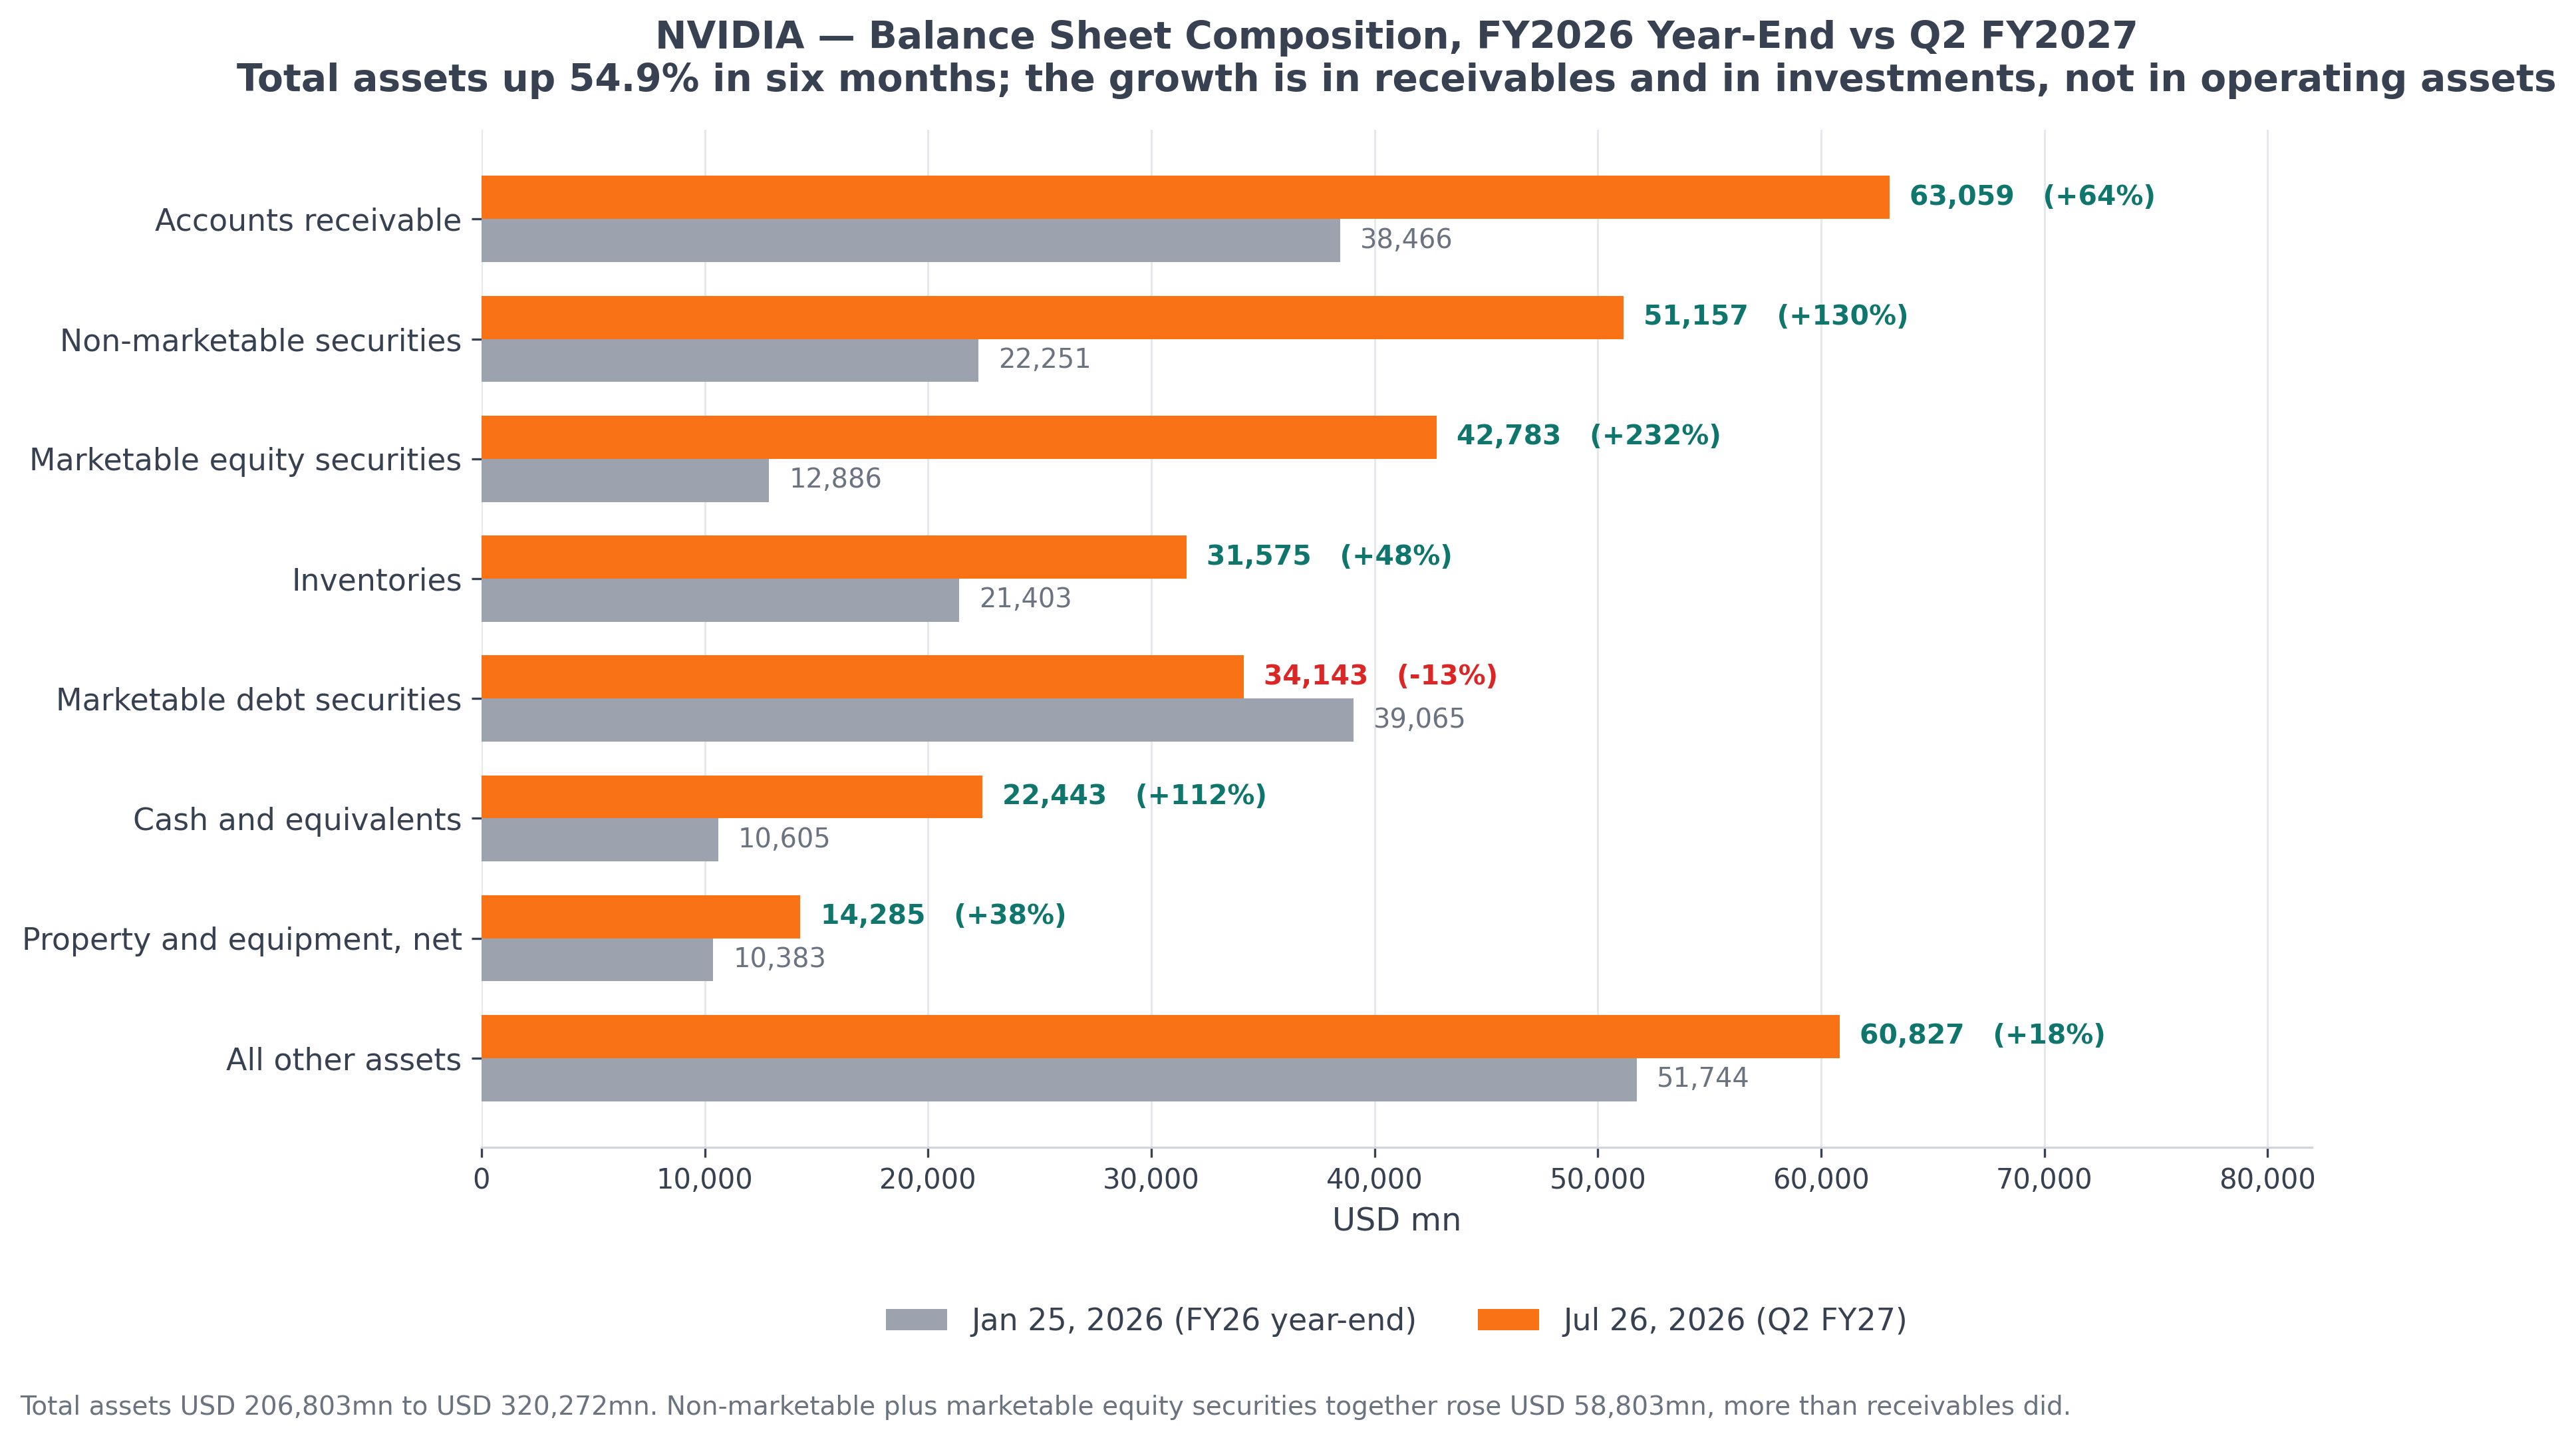
Source: Author's own chart based on NVIDIA's 10-Q. Total assets went from \$206,803mn to \$320,272mn.
Then the counterparties. The top five receivables customers now account for 70%, against three customers at 56% at the start of the year. Of the \$99bn of equity investments already deployed, close to \$50bn went to frontier labs.
Of the \$108.5bn maximum gross guarantee exposure, \$105.0bn, or 96.8%, sits on a single SB Energy transaction. It covers one Ohio campus carrying 4.25GW of IT load, with an OpenAI affiliate as the lessee.
Over the same period the largest single customer fell from 23% to 16% of revenue.
Put the pieces together and the picture is this. The revenue base is diversifying, while collections, investments and guarantees all converge on the same set of counterparties.
The four equity-side houses each recorded fragments of it: the increase in receivables, frontier labs at roughly a quarter of FY2028 sales, the headline commitment and guarantee totals. None of them set the fragments side by side.
The only research that handled the structure came from Morgan Stanley's credit team. Its conclusion is that the core uncertainty lies in the form the support takes and how visible the disclosure is, while NVIDIA's capacity to provide that support is never in question.
Management offers three mitigants. Compute can be redeployed, the ultimate payers are investment grade, and the guarantee terminates once OpenAI obtains a satisfactory rating. All three hold. What they mitigate is loss severity. They leave the concentration of the exposure untouched.
On the two sides of the "circular financing" argument, I laid out the facts and the logic for each in "From Selling Engines to Building Cars" and won't rehearse them here, just record the direction. Fungibility carries more weight this quarter than it did before. Morgan Stanley's credit team connected it to collateral value, and collateral value is exactly where "Can a GPU Really Be Profitable for Six Years?" came to rest.
What the Sell Side Did
All four houses raised price targets, into a \$300 to \$400 range, with no cuts. Three of them compressed the target multiple at the same time.
Post-print price targets and implied upside
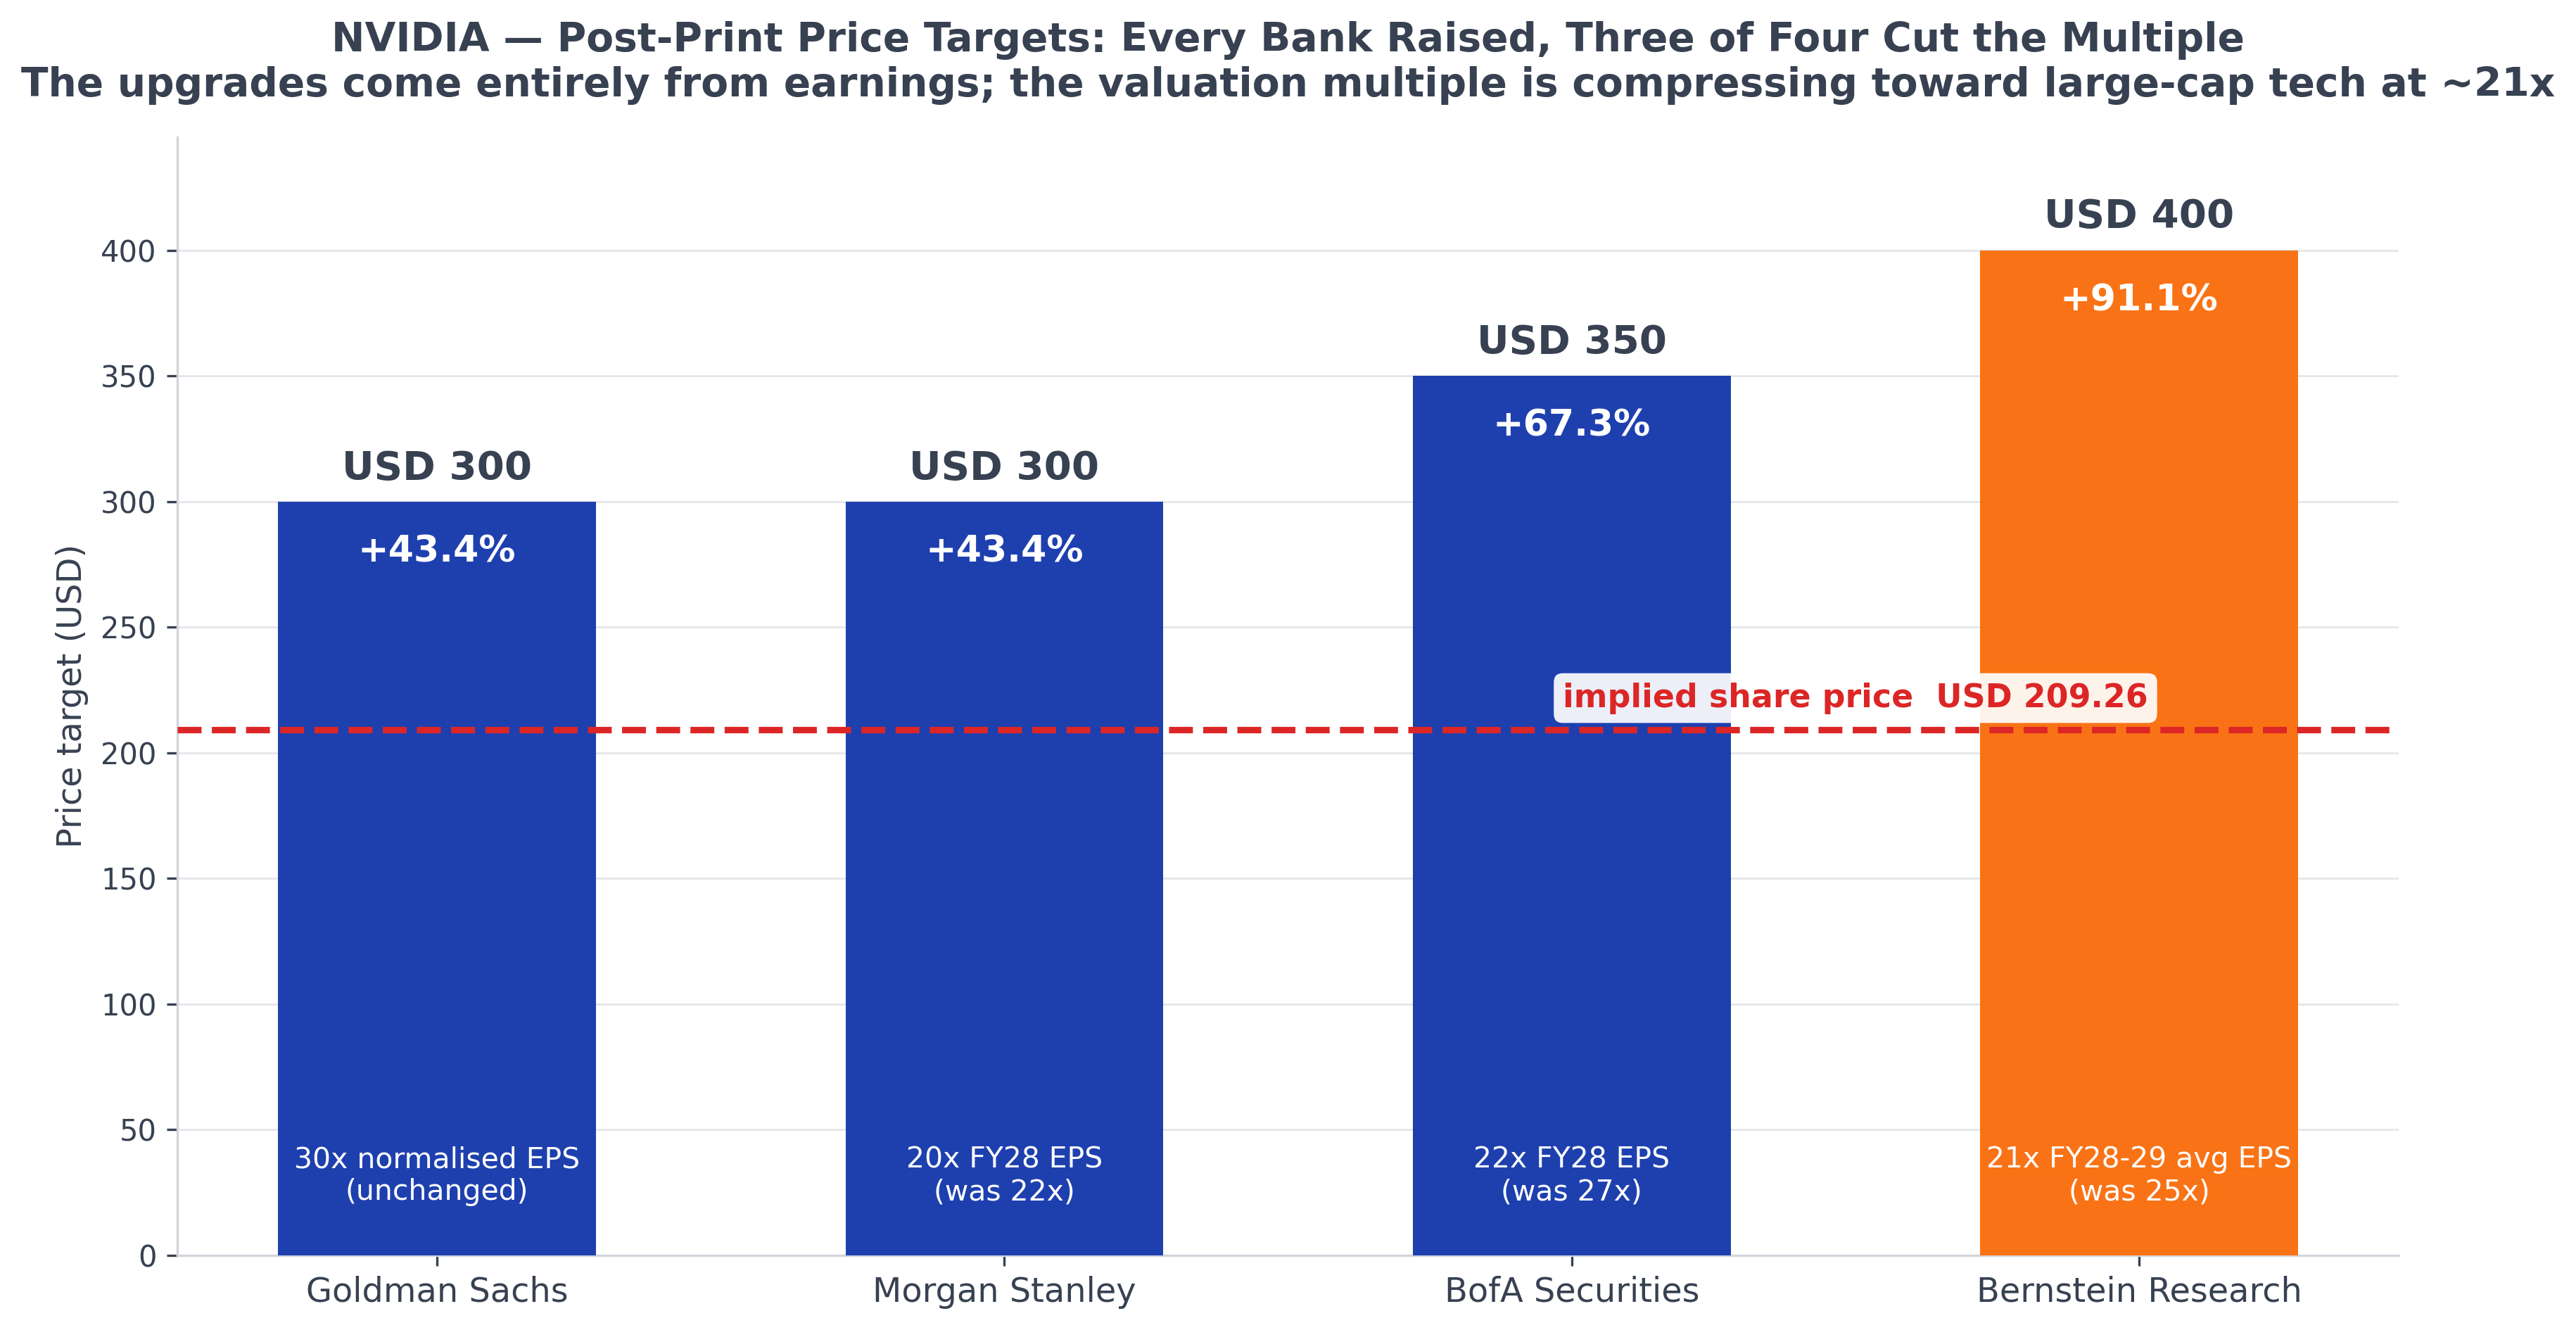
Source: Author's own chart. The implied share price of \$209.26 is derived from market capitalisation and share count.
BofA went from 27 times to 22, Bernstein from 25 to 21, Morgan Stanley from 22 to 20. Only Goldman Sachs held at 30. All three cuts point to the same reasoning: 20 to 22 times sits in line with large-cap tech peers at around 21.
The upgrades come entirely out of earnings. The three FY2028 revenue estimates fall within 0.81% of one another, while non-GAAP EPS estimates spread 5.1%. Guidance has pinned the revenue line, and the disagreement has migrated wholesale into gross margin and expense assumptions.
What these numbers describe is a re-categorisation. The market is moving NVIDIA from an asset carrying a scarcity premium toward a high-growth but mature large cap. Whether that re-categorisation is right sits outside the scope of this piece.
Readings You Can Take Directly Next Quarter
Whether the 70% moves, and in which direction. The company is using its guidance as a supply-chain coordination tool, so any revision to that number carries capacity information with it.
Whether gross margin genuinely troughs at 71% to 72% in Q4. This is the direct test of the borrowed-resilience call.
Whether top-five receivables concentration keeps climbing, and whether the SB Energy guarantee begins terminating as OpenAI obtains a rating.
Rubin unit shipments remain undisclosed on any basis. Going into the print, Morgan Stanley's model carried 150k units for Q3 while Chinese brokers used around 500k, and that three-fold disagreement passed untouched into the next quarter. The one usable proxy is "roughly 20% of Data Center revenue in Q3," which annualises at the October run rate to about \$80bn, close to the size of Broadcom's entire AI semiconductor business.
The absolute figure for trailing CPU revenue. Grace has run above \$5bn over the last twelve months, and the company expects that to more than double next fiscal year.
Goldman Sachs reads the \$20bn as a unit-shipment number, while BofA's CY27E model carries only \$8bn. One more absolute disclosure would settle the ambiguity.
And three questions management left unanswered on the call: the ranking of supply bottlenecks, the product-level split of the roughly \$200bn guidance raise together with the price-increase contribution, and the cash portion of the ecosystem commitments in FY2028. The second bears directly on whether the FY2028 gross margin recovery can be verified independently. Without knowing how much revenue the price increases contribute, there is no way to tell how much of 72% to 73% comes from pricing and how much from mix.
Closing
NVIDIA spent two decades making compute cheaper. This quarter it disclosed two things pointing the other way. A year in advance, how much compute it will not be able to sell. And how much of every dollar now goes to the memory makers.
Neither number is set inside this building. The growth ceiling is decided by land, power, shell and wafer capacity. The slope of the gross margin is decided by three memory suppliers. For a company that has reached the top of a supply-constrained industry, that is the normal condition.
Guidance by subtraction leaves exactly one question. Does the 70% move, and which way does the supply chain push it. Raise it, and supply has caught up. Cut it, and the year-early candour will have cost more than it looked.
Earnings Call Recap
Financials
I will now share a more detailed analysis on this earnings result behind the paywall:


