The Third Scaling Law: AI Agents Learn From Real-World Environments Along a Predictable Log-Sigmoid Curve
Do AI agents genuinely learn on the job, or are they just rolling the dice until something sticks? A 38,000-hour study finds the learning is real, fits a log-sigmoid scaling law with R² = 0.998, and is getting twice as fast every three months.


The Third Scaling Law: AI Agents Learn From Real-World Environments Along a Predictable S-Curve
An agent picks up a real assignment: reconstruct the full signal analysis of the GW150914 gravitational-wave detection from LIGO's raw strain data. No internet, no answer key. Just the data, the documentation, a workspace it can freely tear apart, and a scoring judge sealed inside an isolated container. Over 12 hours it made 224 submissions, of which only 27 actually moved the best score forward. It started at 42.8 points. By the end of the shift: 67.0.
This is not an exam. It is a job. And "exam" is exactly what AI evaluation has defaulted to for years: MMLU tests knowledge, AIME tests competition math, SWE-bench grades the final patch. All of them measure endpoints. None of them measure the process, which means none of them can answer the question that sits closer to the substance of productivity: drop an agent into an unfamiliar environment, and does it get better as it works?
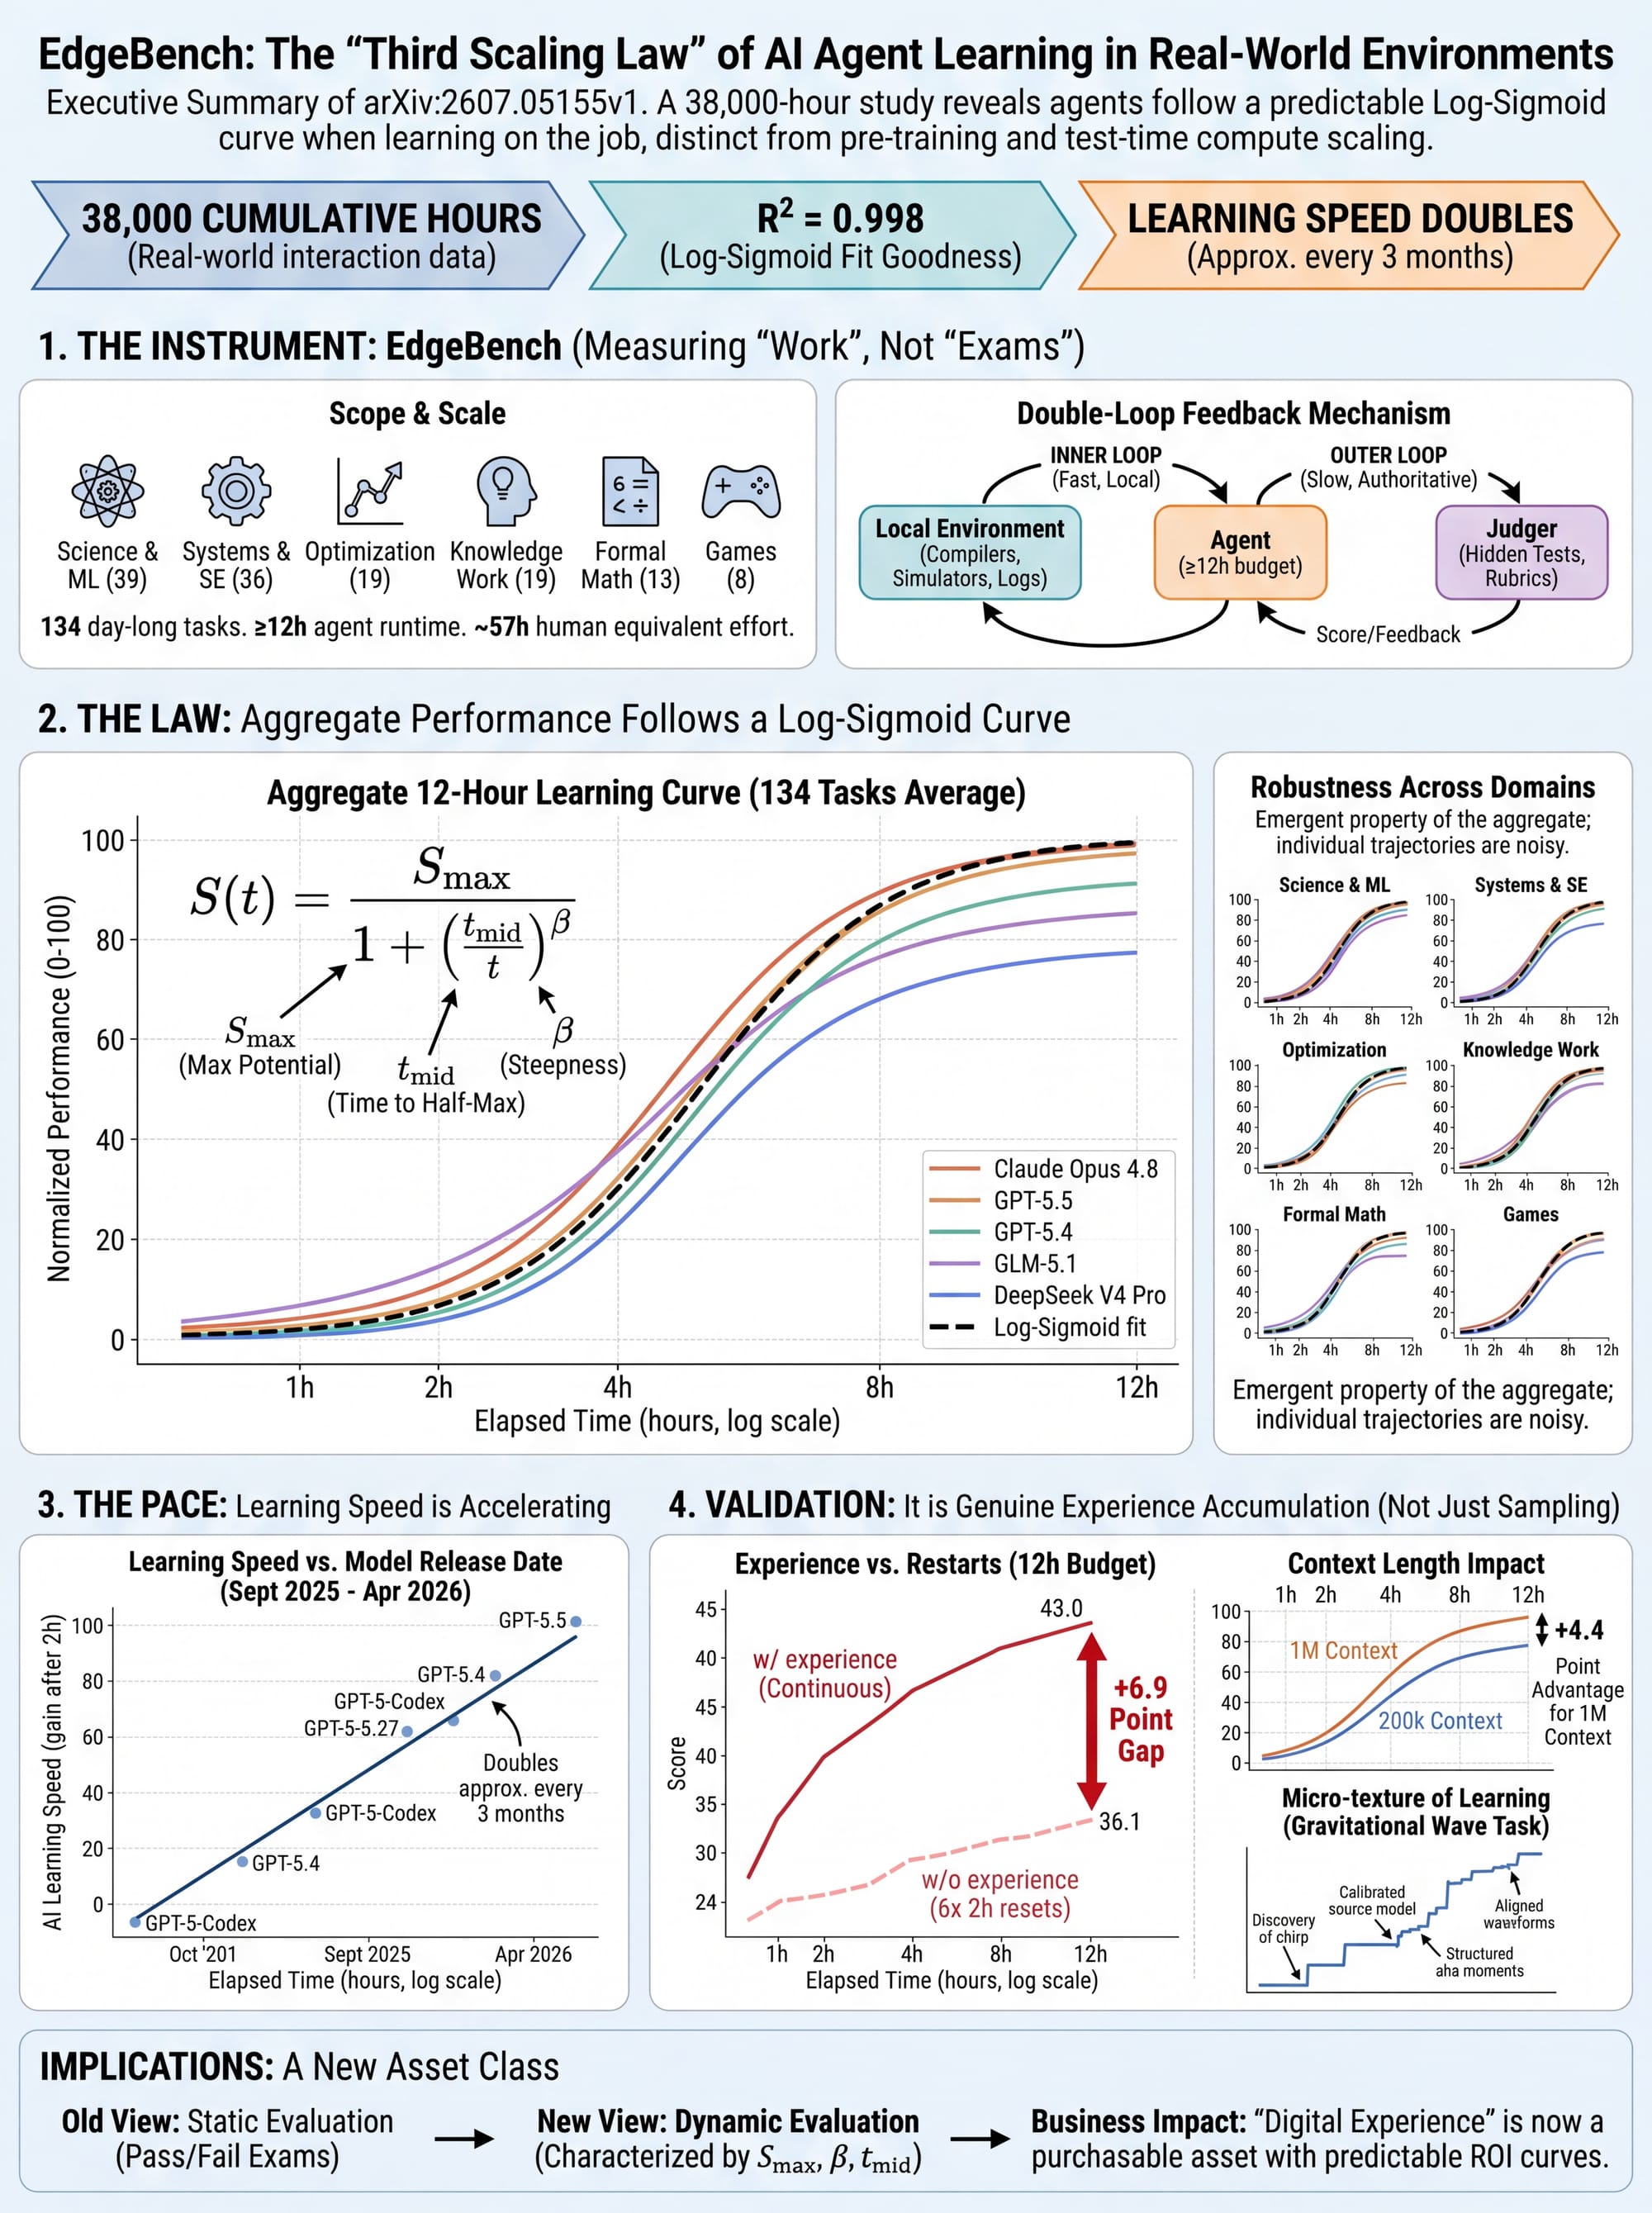
A new paper built the EdgeBench benchmark to deliver the most systematic answer so far: yes, and with a regularity few would have expected. The team analyzed roughly 38,000 hours of environment-interaction data from 5 frontier models across 134 real-world tasks, and found that agents' aggregate performance over interaction time follows a log-sigmoid curve with an R² of 0.998. Predictable performance curves are being drawn one axis at a time. The first was the power law of pre-training compute. The second was post-training compute: last October I unpacked ScaleRL, where the compute-performance relationship of RL post-training turned out to be a sigmoid as well, extrapolable from the first 1.5k GPU hours out to 100,000 and beyond. What this paper draws is the third axis: the curve of an agent learning from environmental feedback after deployment. The independent variable is no longer any form of training compute but interaction time. The curve is just as smooth, just as extrapolable, and the speed of the climb is itself accelerating.
A Yardstick for Work, Not for Exams
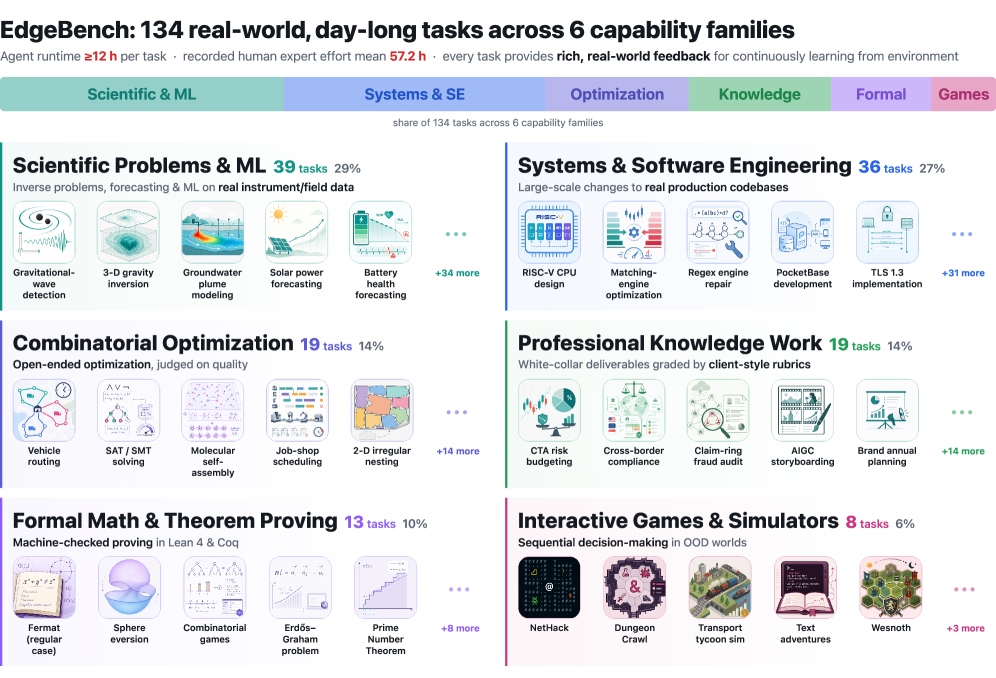
To measure learning rather than memory, the yardstick itself had to be rebuilt. The authors' reasoning: learning behaviors (exploration, strategy revision, the accumulation of experience) only surface given enough time and sufficiently real feedback, while short tasks tend to be solved from memory. So all 134 EdgeBench tasks are designed at day scale, supporting at least 12 hours of continuous frontier-model operation, against a benchmarked human-expert workload averaging 57.2 hours. The tasks span six domains:
- Scientific problems & ML (39 tasks): real research data and experimental setups from working scientists; most are open problems with no known optimum
- Systems & software engineering (36 tasks): development on production-grade codebases, where a single task can touch thousands of lines of code, the largest over 100,000
- Combinatorial optimization (19 tasks): open-ended, mostly NP-hard problems where exact methods are infeasible and progress comes from designing and iterating heuristic search
- Professional knowledge work (19 tasks): replicas of real white-collar deliverables in finance, education, healthcare, and law, calibrated to roughly 3 full working days for a professional with 3+ years of experience
- Formal mathematics & theorem proving (13 tasks): large-scale machine-verified proofs built in Lean
- Interactive games & simulators (8 tasks): real games built for human players, procedurally generated so every run is unique, creating out-of-distribution pressure
The EdgeBench task map: 134 tasks across six capability families
Source: EdgeBench paper (arXiv: 2607.05155)
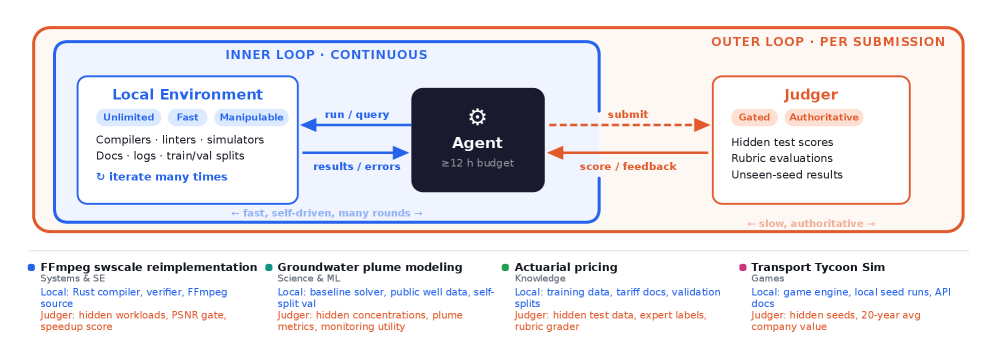
Feedback is the other half of the design. In real engineering and research work, practitioners iterate through two complementary loops: a fast local loop (run tests, read errors, revise) and a slower external loop (deliver, get reviewed, get sent back). EdgeBench replicates this with a two-container architecture. The agent explores freely inside a worker container (the inner loop) and submits work to a judge container that never exposes its scoring logic, receiving calibrated scores or diagnostics in return (the outer loop). For software tasks the judge is hidden tests; for science, validation splits; for professional work, grading rubrics. Polish locally, submit, get bounced, revise: that rhythm is the everyday structure of white-collar work.
EdgeBench's double-loop feedback architecture: an agent-driven inner loop and a judge-mediated outer loop
Source: EdgeBench paper (arXiv: 2607.05155)
A Curve With an R² of 0.998
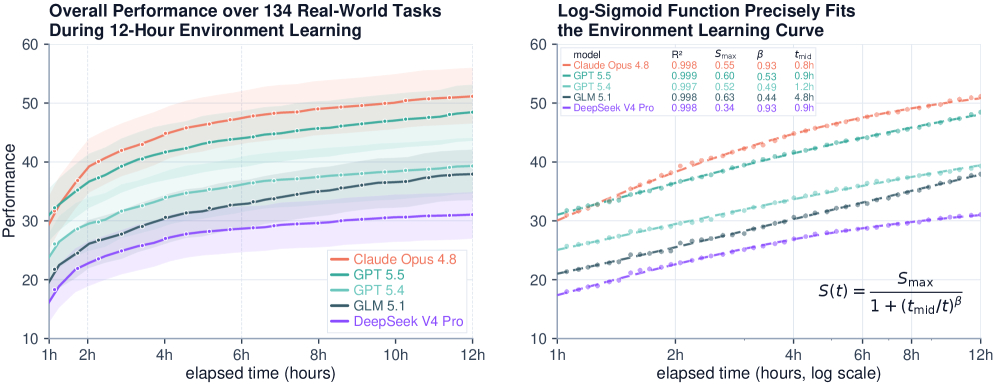
The experiment covers 5 frontier models: Claude Opus 4.8, GPT-5.5, GPT-5.4, GLM-5.1, and DeepSeek-V4-Pro (preview), with every task-model pair run independently 3 times for 12 hours each, full submission trajectories logged. Individual task curves come in every shape: smooth climbs, long plateaus broken by sudden jumps, repeated regressions. But average across all 134 tasks and the noise falls away. All five models' aggregate curves converge onto the same three-parameter function:
Twelve-hour learning curves averaged over 134 tasks: all five models fit a log-sigmoid, with R² between 0.997 and 0.999
Source: EdgeBench paper (arXiv: 2607.05155)
Investors will recognize this curve. Mathematically it is the logistic growth that adoption studies have leaned on for decades, a close cousin of the Bass diffusion model. S_max is the attainable score ceiling, t_mid the interaction time needed to reach the halfway point, and β the steepness of the climb. The only difference is the horizontal axis: "years" has been swapped for the log of the time an agent spends inside its environment.
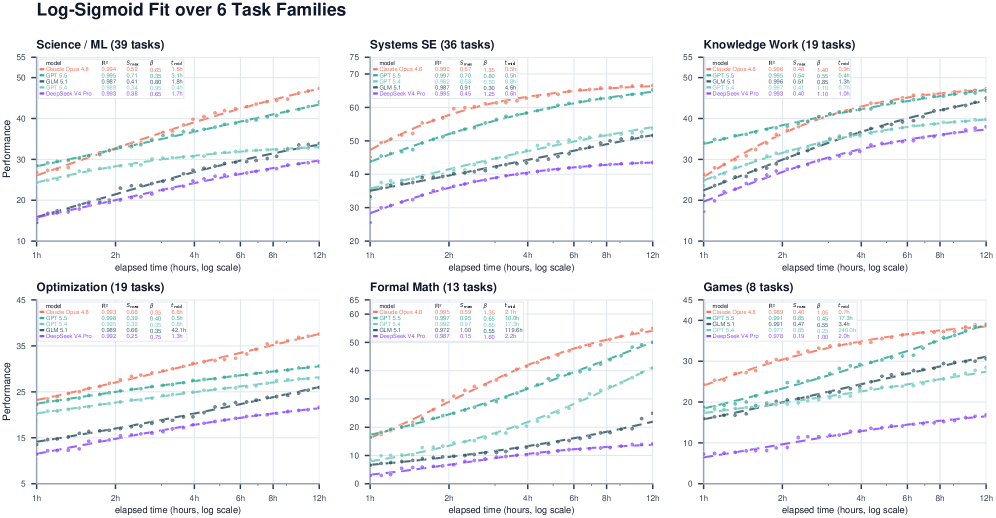
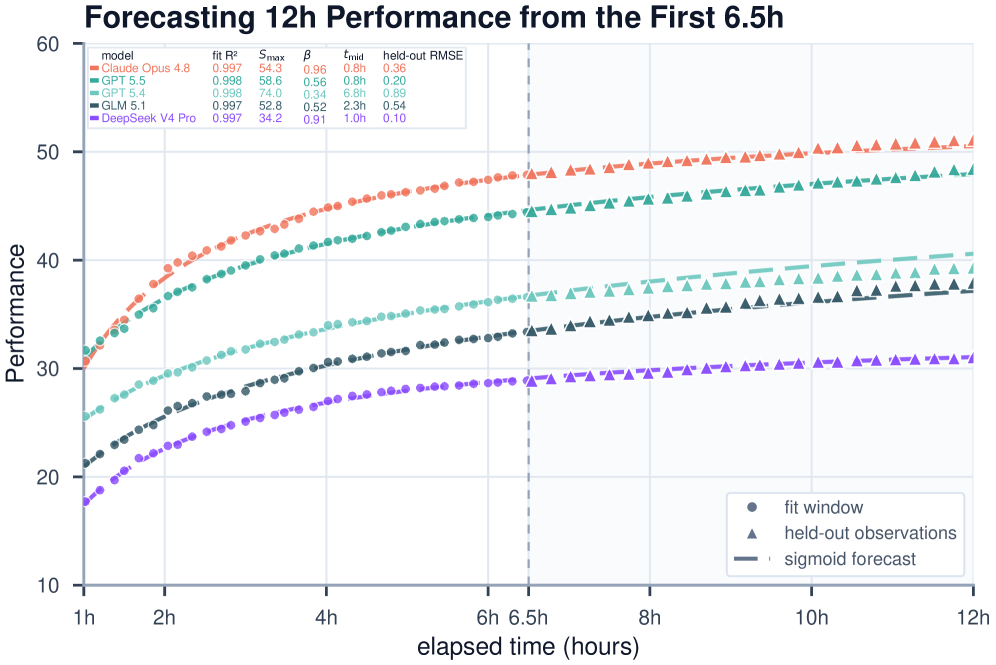
The law held up under four checks. First, split into the six capability families, the same functional form holds in every one, despite visibly different knowledge demands and curve shapes. Second, stretch the interaction window from 12 hours to 28 (80 tasks, 4 models) and to 72 (18 tasks, 2 models), and the fits stay at R² ≥ 0.993. Third, it predicts: fit on the first 6.5 hours only, extrapolate onto the held-out 6.5-to-12-hour trajectories, and all five models land on target, with R² ≥ 0.997 and RMSE under 1.0 performance points. Fourth, against other common S-curve families (log-probit, log-Gompertz, Weibull CDF), log-sigmoid posts the lowest fitting error (RMSE of 0.390), while a two-parameter log-linear baseline does far worse (0.717), evidence that the signal is a genuine sigmoid rather than a simple log-linear improvement.
Split across the six capability families, the log-sigmoid still holds
Source: EdgeBench paper (arXiv: 2607.05155)
Predicting the 12-hour endgame from the first 6.5 hours of trajectory
Source: EdgeBench paper (arXiv: 2607.05155)
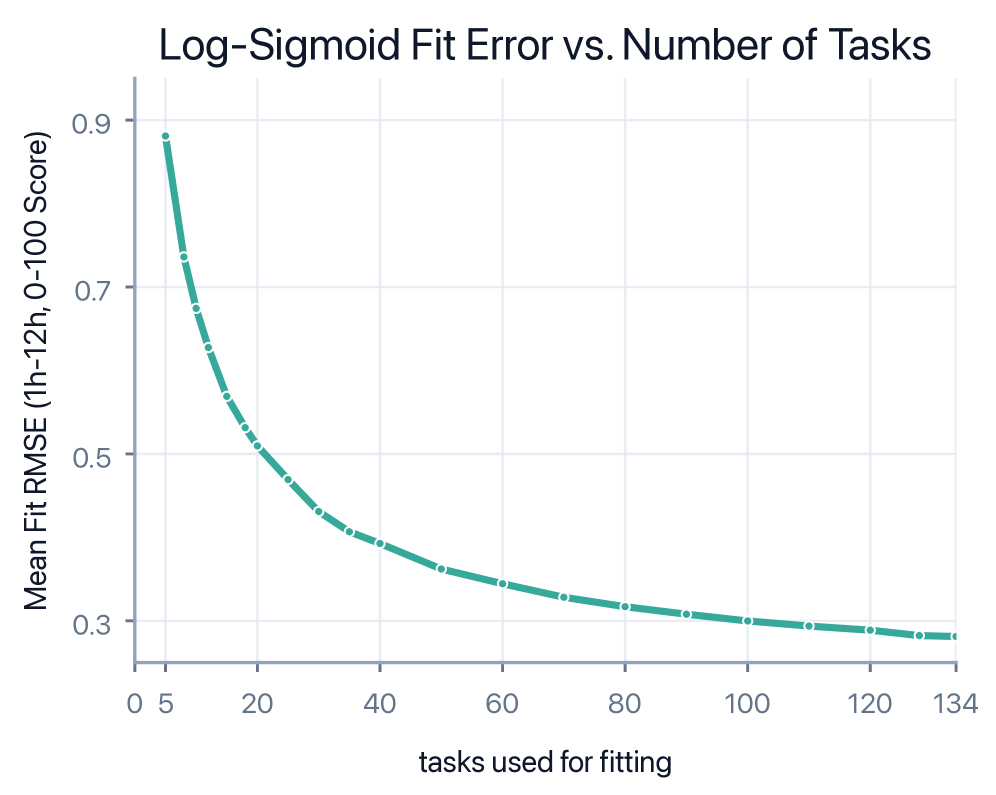
The law carries one more methodological property: it is an emergent, population-level regularity. In March I wrote about an experiment in which NVIDIA let an agent run alone on a Blackwell B200 for seven days, ending with attention kernels 3.5% faster than cuDNN; that single trajectory was a staircase, long plateaus punctuated by discrete jumps, with barely any regularity visible on its own. EdgeBench's individual task trajectories are just as jagged. The law shows up in the aggregate: as the number of tasks entering the average grows from 1 to 134, the residual error declines monotonically. Individuals are staircases; the population is a curve. The regularity lives in the collection of tasks, not in any single one.
The more tasks enter the average, the lower the fitting error
Source: EdgeBench paper (arXiv: 2607.05155)
Why an S-Curve, of All Things
The authors offer a first-principles derivation; the intuitive version goes like this. Picture a complex task as a graph waiting to be unlocked. Writing a report requires organizing the data, then building the framework, then drawing conclusions: the nodes depend on one another. Learning is "frontier expansion." Unlocked nodes supply reusable capability, locked nodes represent the remaining room for improvement, so the rate of progress is proportional to the product of the two, x(1-x). Like teching up in a real-time strategy game: no traction in the opening, dominoes falling once the key technology unlocks in the midgame, and a stubborn remainder in the endgame.
As for why the horizontal axis is log time: task difficulty is self-similar. Each step up in difficulty multiplies the graph structure that must be searched, and a linear supply of compute buys only logarithmic progress in depth. Combine the two and the macro outcome is necessarily a log-sigmoid. The authors are candid about the boundaries: the law can fail when the task graph contains hard bottlenecks, when task midpoints are too dispersed, or when the structure is not self-similar.
Learning Speed Doubles Roughly Every Three Months
The second finding answers a more dynamic question: whether newer generations of models learn faster. Comparing raw totals would conflate prior knowledge with environmental learning, since a high score may just mean the model already knew. The authors' fix was to select 18 EdgeBench tasks on which every evaluated model starts from the same line (first-attempt scores averaging 6.87 ± 0.97), then grant each a fixed 2-hour budget and compare how far it climbs.
The result is a Moore's Law-style straight line: from GPT-5-Codex in September 2025 to GPT-5.5 in April 2026, learning speed rose roughly 8-fold in 221 days; a log-linear fit to the top two models at each release date implies a doubling roughly every 3 months.
Learning speed against model release date: a straight line on a log axis, doubling about every 3 months
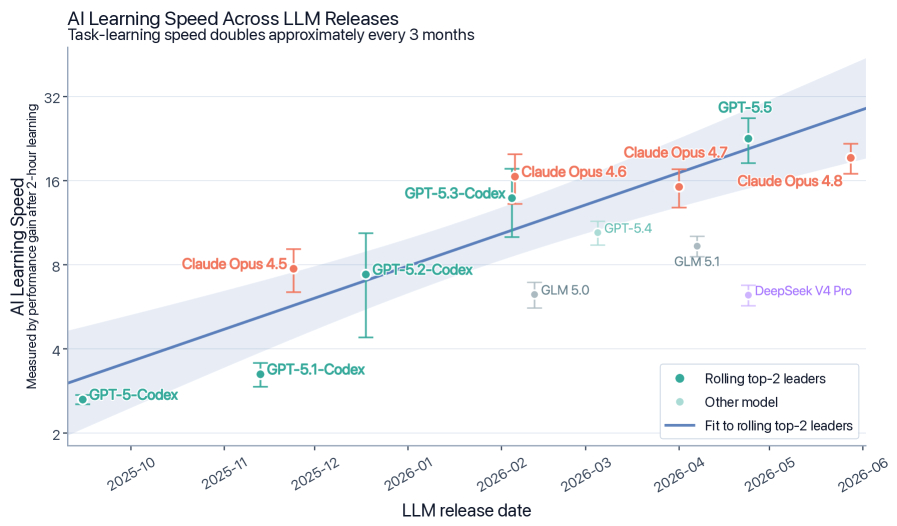
Source: EdgeBench paper (arXiv: 2607.05155)
The AI world does not lack doubling curves. When I took apart the "400× engineer" numbers in May, I leaned on METR's time-horizon index: the length of task a model can complete doubles roughly every 212 days, at a fit of R² ≈ 0.98. The two yardsticks measure different things. METR tracks the capability ceiling across model generations; EdgeBench tracks how fast a single agent learns within a fixed budget. The latter's doubling period, roughly 90 days, is less than half the former's. If both curves hold, learning fast is steepening faster than lasting long.
A natural objection: newer models may simply submit more often, buying more chances to get lucky. The data does not support that reading. Submission frequency did not move uniformly across model families (newer GPT models submit more actively; other families do not), while what rises consistently is the "effective submission rate," the share of submissions that set a new best. The clearest datapoint is Claude Opus 4.8: it submits less often than GPT-5.5 yet finishes highest overall (51.3 versus 48.4 at 12 hours). Stronger agents also spend their feedback more deliberately: establish a submittable baseline, protect the current best, make focused changes, and let feedback decide whether to keep or roll back.
Learning, or Just Rolling the Dice
A rising score alone proves nothing about learning; longer runs also mean more chances to stumble onto good answers. The experiment I find most load-bearing in the paper pits the two explanations directly against each other. Claude Opus 4.8 gets the same 12-hour budget on 17 tasks, in two configurations: one works continuously, keeping its full workspace and feedback history (with experience); the other is chopped into 6 independent 2-hour attempts, memory wiped between each, best result kept (without experience, i.e. pure repeated sampling).
Same 12-hour budget: continuous accumulated experience reaches 43.0, six cold restarts reach 36.1
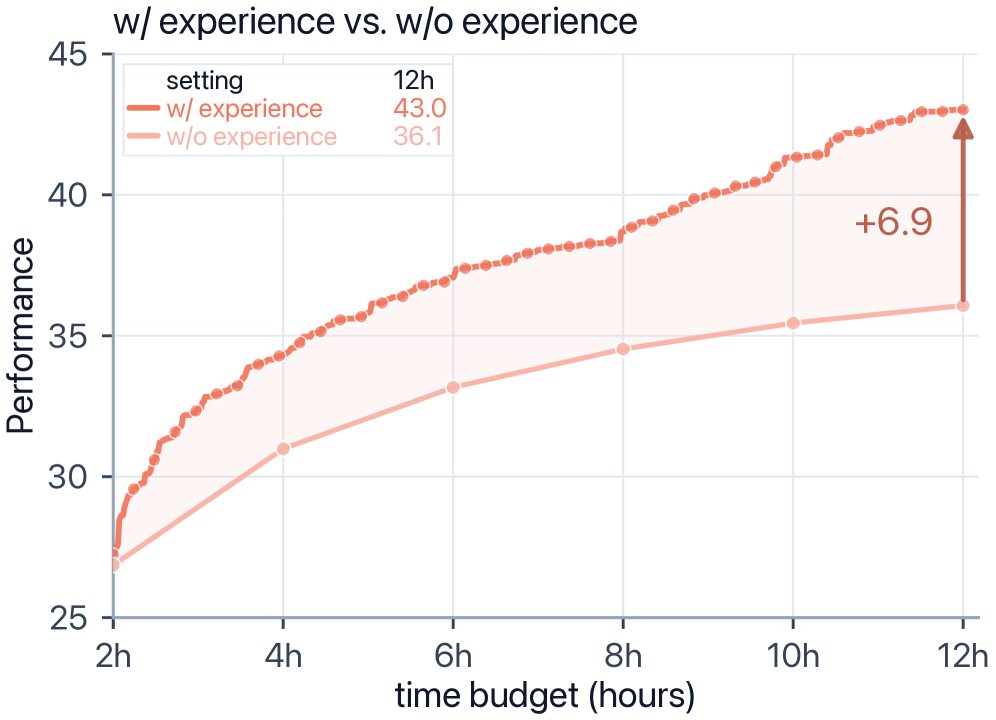
Source: EdgeBench paper (arXiv: 2607.05155)
At the 12-hour mark, "with experience" scores 43.0 against 36.1 "without," a gap of +6.9, and it leads at every checkpoint along the way.
The compounding of experience is real.
This control condition reads as if it were designed for Richard Sutton. The father of RL has argued that LLMs are a dead end on the road to AGI (I worked through his full argument last October): genuine intelligence must learn from experience, which he defines as "the observed consequences of your actions." EdgeBench adjudicates exactly half of that proposition. The side that wins by +6.9 is carrying precisely Sutton's kind of experience, yet the vessel turns out to be the LLM's context, not RL's weight updates. On experience, the data sides with Sutton. On the vessel, at least within this 12-hour window, it does not.
A companion ablation on context length pins down where that experience lives. Across 42 tasks, Opus 4.8 with a 1M-token context window stays ahead of the same model at 200k for the entire run, the gap easing only slightly from +5.8 at 2 hours to +4.4 at 12. External workspace and platform state are identical; the sole variable is how much the model can hold in memory, and it converts directly into points.
1M versus 200k context window: same model, same tasks, a 4-to-6-point lead throughout
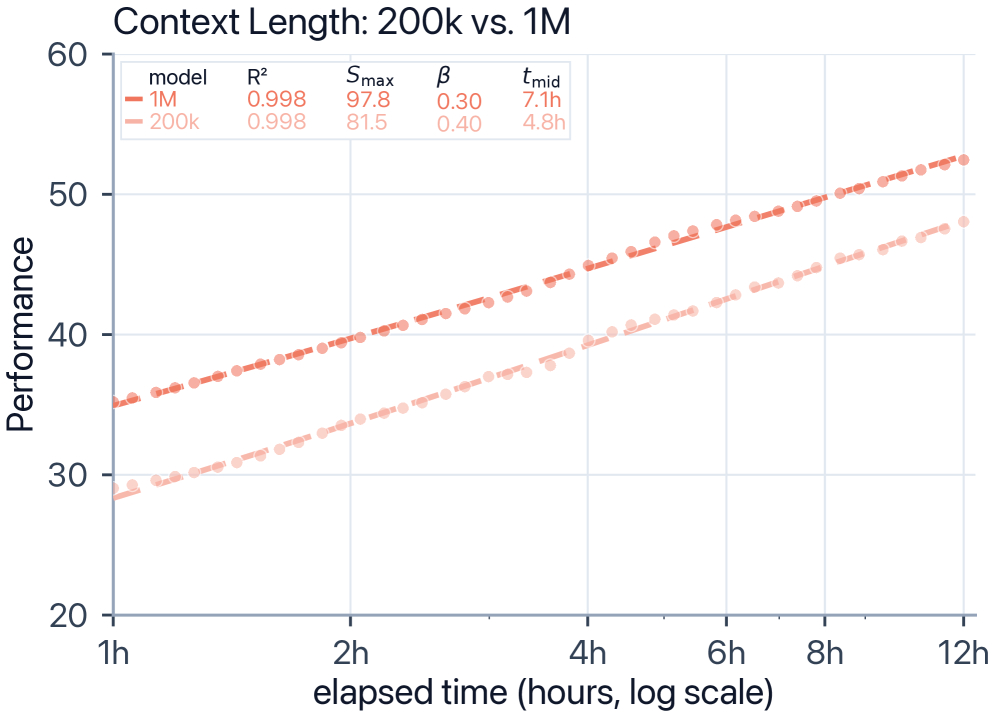
Source: EdgeBench paper (arXiv: 2607.05155)
These numbers collide head-on with the "AGI health check" I wrote about last October. Dan Hendrycks and coauthors' definition-of-AGI framework scores both GPT-4 and GPT-5 at 0% on Long-Term Memory Storage, and classifies compensating for missing memory with an enormous context window as capability distortion; the analogy I used then was a student with a terrible memory carrying every textbook into an open-book exam, where a high score proves no learning. EdgeBench does not overturn that judgment. The moment the task ends, the experience is wiped all the same. What it adds is the market's view: the same model carrying 800k more tokens into the exam room reliably earns 4 to 6 more points. The open-book student has indeed learned nothing, but clients sign off on deliverables, not on memory mechanisms.
Return to the gravitational-wave task from the opening, and the fine-grained texture of this learning comes into view. Only 27 of 224 submissions improved the score by at least 0.1 points: the loop is sparse. But it is structured. The agent first made the task measurable (starting from 42.8), then decomposed the murky errors into subproblems (time-frequency localization, digitizing the reference traces, climbing to 52.3), then calibrated the two-body source model between hours 4 and 5, jumping the velocity/separation sub-score from 64 to 89 and the total to 59.7, and finally spent over 6 hours on time-shift alignment of the Hanford waveform, grinding that sub-score from roughly 47 to 95. A large volume of failed probes buys a small number of breakthroughs that settle into milestones. Anyone who has supervised a junior researcher will recognize the rhythm.
The full trajectory of the gravitational-wave reconstruction task: 7 milestones, from 42.8 to 67.0
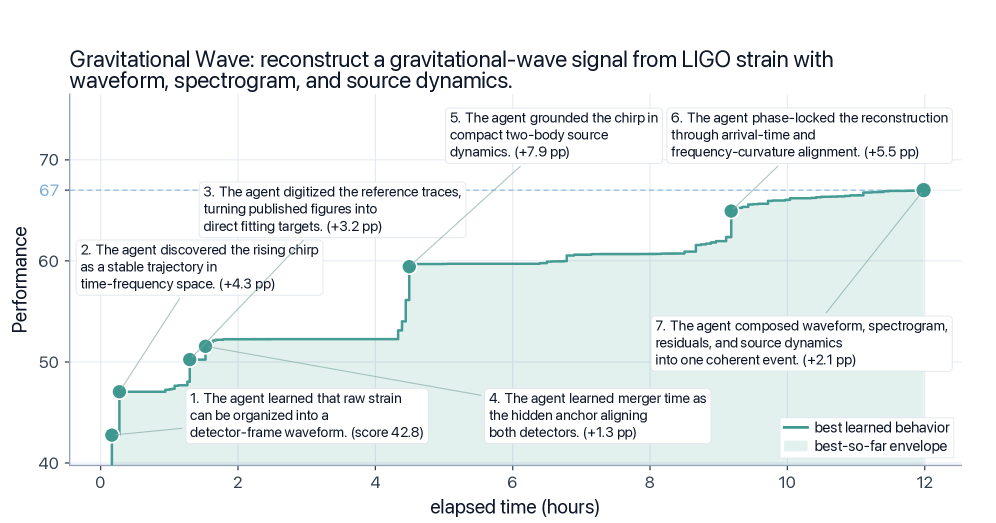
Source: EdgeBench paper (arXiv: 2607.05155)
An Analyst's Four Question Marks
The paper's chain of evidence is complete. But by the discipline I set down in the "400× engineer" piece (understand what a yardstick measures before you read the measurement), a few places call for haircuts of your own.
On the leaderboard (Opus 4.8 in front): the harnesses are not aligned. Opus 4.8 ran mainly on Claude Code with a 1M context window, the GPT models on Codex at 256k, and GLM-5.1 and DeepSeek-V4-Pro on Claude Code at 200k. The paper's own ablation prices the 1M-versus-200k window difference at +4.4 points over 12 hours, larger than the 2.9-point gap between first and second place. The leaderboard therefore measures model-plus-harness systems rather than bare models, and rankings deserve that discount. The paper does not confront this directly; the inference is mine, drawn from its own data.
On "doubling every three months": the trendline covers a 221-day release window and fits only the top two models at each point in time. The evidence behind the curve itself (an R² of 0.998 with 38,000 hours underneath) and the evidence behind the doubling cadence are not in the same weight class; the latter is a line drawn through a handful of points spanning seven-plus months. Treat it as an early signal worth tracking, not yet a law.
On the law's scope: log-sigmoid is a population regularity; single-task trajectories remain noise-dominated and jagged. It predicts the average progress of a basket of tasks, not the schedule of any specific use case. S_max is only the ceiling supported within the fitted range, not an absolute cap on capability. Long-horizon evaluation also sweeps API serving stability into the measurement; GPT-5.4's late-run scores absorbed noise from service disruptions, which the paper's appendix discloses. And every result so far comes from the authors' own evaluation platform, so independent replication is pending.
On what "learning" means here: EdgeBench measures in-context learning. Experience lives in the context window and the workspace, and when the 12-hour task ends, it is wiped. Persistent learning across tasks and sessions (memory systems, weight updates) sits outside the scope. This is exactly the first deficiency Andrej Karpathy listed for agents (covered in my "summoning ghosts" piece): "You cannot teach it something and expect it to remember and apply that knowledge, unlike a human colleague." The weight-level continual learning he meant goes unrefuted here. What EdgeBench measures, and for the first time puts a scale on, is the thing Karpathy regards as the true manifestation of intelligence: in-context learning. "Agents learn," as a conclusion, currently holds within a single task's lifetime. As an aside, RL post-training also learns from environmental feedback (in this essay's lineage it owns the second curve), so the "third curve" framing is not entirely fair to it; the paper's defense is that RL's training costs confine its scaling evidence to narrower task distributions, while the in-context route bought coverage of 134 environments at a far lower unit cost.
What This Curve Changes for Investors
Even with those haircuts applied, the paper gives several concrete pushes to how we watch AI.
The model-evaluation dashboard is changing. Once a learning curve can be captured in three parameters, the answer to "which model is strongest" refines from a single rank into a set of curve parameters. The fitted table in Figure 1 already shows the information gain: Opus 4.8 starts fast and climbs steep (t_mid of 0.8 hours, β of 0.93), while GLM-5.1's fitted ceiling is actually higher (S_max of 0.63) but takes 4.8 hours to reach halfway. For buyers with different time budgets and task shapes, the optimum may differ. Single-shot Q&A benchmarks cannot see this dimension.
The demand side of inference compute now has a return curve. Until now, "give the agent more time" was an unpriced line item. It is now a curve that can be fitted and extrapolated: an enterprise can, in principle, use β and t_mid to decide whether a task deserves a 2-hour or a 72-hour budget. Layer on the every-3-months doubling of learning speed, if it holds, and the performance gain purchasable with the same interaction time is rising fast. This hands long-horizon agents' token consumption a demand-side mathematical skeleton, and the study's own 38,000 hours of interaction are a sample of what that workload looks like.
The white-collar "experience premium" now has a machine-side benchmark. EdgeBench's 19 professional knowledge-work tasks replicate deliverables that take a professional with 3 years of experience roughly 3 full working days, and these tasks obey the learning curve too. The 4-to-6-point gap in the long-context ablation adds one more datapoint: the capacity to remember more converts directly into task performance, an empirical anchor for pricing premium long-context products.
Pre-training's scaling law was a single paper in 2020; today it is the reason an entire industry plans its capital expenditure. The environmental-learning curve has, as of now, 38,000 hours of data and one R². But if it holds, an agent's work experience becomes the fourth thing that can be measured and bought, after parameters, data, and compute. The next question is who gets to price experience.


