
Mastercard FY2025 Annual Report Visualization: The Flywheel, the Tax Shield, and the Siege
Is Mastercard's flywheel spinning fast enough to outrun Pillar 2 taxes, stablecoin disruption, and a regulatory siege that its own 10-K lays bare?


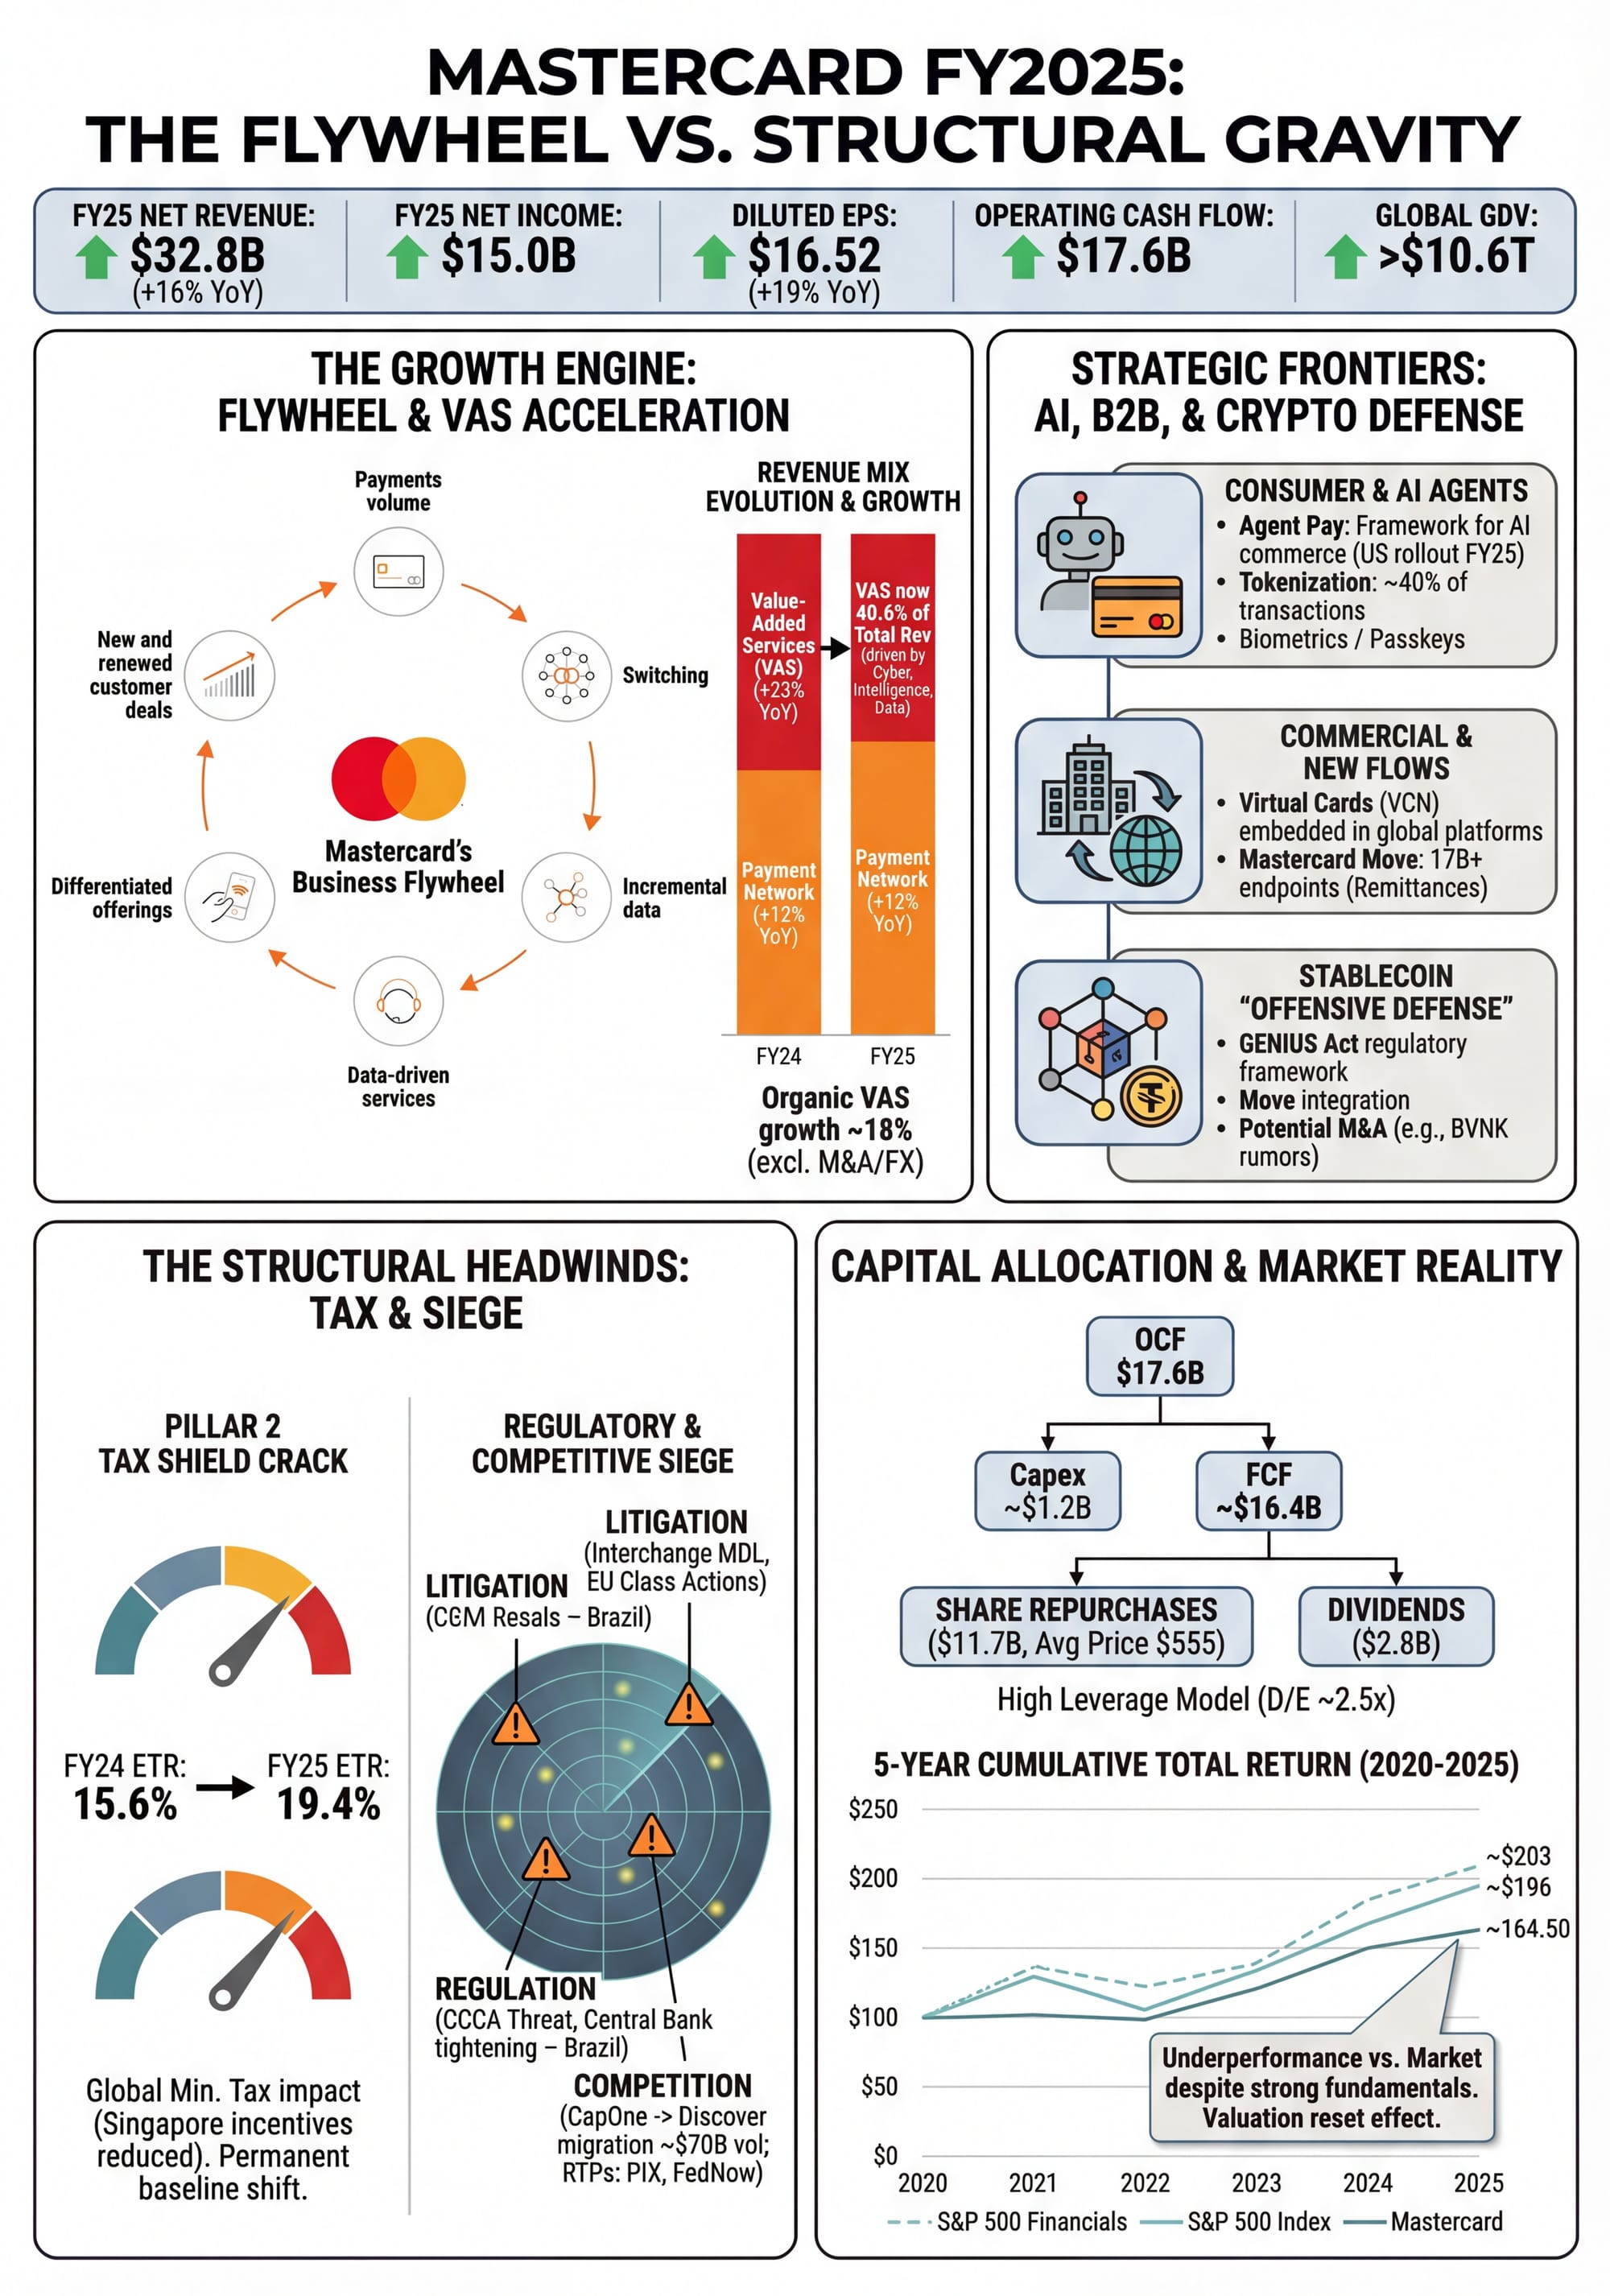
Mastercard FY2025 10-K: The Flywheel, the Tax Shield, and the Siege
In 2025, Mastercard delivered a textbook annual report: $32.8 billion in net revenue, up 16% year-over-year; $15.0 billion in net income; diluted earnings per share of $16.52, a 19% increase; operating cash flow of $17.6 billion; and free cash flow of approximately $16.4 billion. Global Gross Dollar Volume (GDV) surpassed $10.6 trillion. Switched transactions reached 175.5 billion.
None of this should come as a surprise. If you've followed this company for any length of time, you know that Mastercard's business model possesses an almost physics-like certainty — every digital payment that displaces cash, every cross-border purchase, every moment a new emerging market plugs into the electronic payments grid, another unit of fuel enters the machine.
But the reason this year's 10-K warrants a careful read isn't simply the strength of the numbers. It simultaneously reveals a profound transformation underway at the company, and the structural headwinds that transformation must confront. On one side, Value-Added Services (VAS) is growing at nearly twice the rate of the core payment network — an accelerating metamorphosis. On the other, a new global minimum tax, stablecoin competition, and a tightening regulatory cordon are applying pressure from every direction.
This is a story about a flywheel and the forces of gravity.
The Flywheel: From Payment Network to Data Platform
Understanding Mastercard begins with understanding its flywheel.
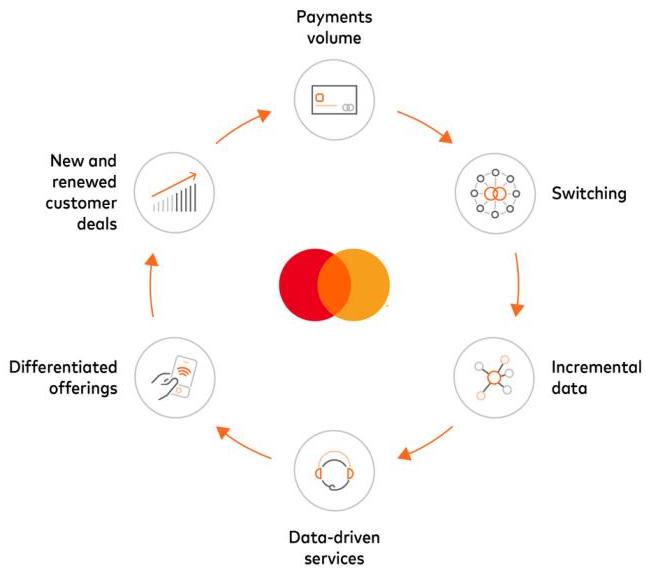
Mastercard's Business Flywheel
source: Mastercard FY2025 10-K
This diagram, drawn directly from the 10-K, is the Rosetta Stone for decoding the entire business. Payments volume drives switching, switching generates incremental data, data feeds data-driven services, those services create differentiated offerings, differentiated offerings win new and renewed customer deals, and those deals bring in more payments volume. Round and round it goes, each revolution reinforcing the last.
Traditionally, the market has viewed Mastercard as a toll collector — every card swipe yields a commission. That framing is not wrong, but it is no longer sufficient.
The FY2025 revenue structure makes this abundantly clear. Payment Network revenue came in at $19.5 billion, growing 12% year-over-year. Value-Added Services and Solutions (VASS) revenue reached $13.3 billion, surging 23%. VASS now accounts for 40.6% of total revenue, up from 38.5% the prior year.
23% versus 12%. That gap is not an accident. It reflects years of strategic investment beginning to compound — security solutions, digital authentication, consumer acquisition services, business intelligence, processing and gateway capabilities, and the cyber threat intelligence capabilities acquired through Recorded Future are all contributing to revenue at an accelerating clip. As we analyzed in our 4Q25 Earnings Review, CEO Michael Miebach described the relationship between the payment network and VAS as a "virtuous cycle" — the network processes over 175 billion transactions annually, with more than 70% switched through Mastercard's own infrastructure, and that massive data trove forms the foundation for building differentiated VAS solutions. CFO Sachin Mehra added a key detail: 60% of VAS revenue is directly tied to the network, benefiting from underlying drivers like transaction growth and tokenization.
Worth noting: within VASS's 23% growth, organic expansion contributed 18 percentage points, acquisitions added 3 points (primarily Recorded Future), and favorable currency translation provided 2 points. Even stripping out acquisitions and FX, the 18% organic growth rate nearly doubles the payment network's 12%. This is not a one-quarter aberration. It is the flywheel, doing exactly what flywheels do.
Three Fronts: Consumer Payments, Commercial Flows, and AI Agents
The 10-K organizes Mastercard's strategic priorities into three fronts: consumer payments, commercial and new payment flows, and services and solutions. These are not independent silos — they reinforce each other at every point of intersection.
Consumer payments remain the foundation. The structural opportunity of cash displacement is far from exhausted. Mastercard operates its network across more than 220 countries and territories, in over 150 currencies. Debit and prepaid GDV totaled $5.3 trillion (up 9%), credit GDV reached $3.9 trillion (up 8%), and commercial cards — the fastest-growing segment — hit $1.4 trillion (up 11%).
But what makes this front genuinely interesting is not the steady march of GDV. It is the generational upgrade happening beneath the surface.
Approximately 40% of all Mastercard transactions were tokenized in 2025 — real card numbers replaced by secure tokens. This percentage continues to climb, directly improving transaction security and approval rates while laying the infrastructure for downstream digital services. Click to Pay is simplifying online checkout. Mastercard Payment Passkey Service is introducing biometric authentication. One Credential lets consumers choose their preferred funding source across multiple payment methods from a single interface.
The most forward-looking move, however, is Mastercard Agent Pay. This is a payment framework designed specifically for AI agent commerce, supporting both AI-assisted and fully autonomous agent-initiated payments. It builds on existing tokenization capabilities — including Agentic Tokens — and the company's dispute management infrastructure. By the end of 2025, Agent Pay covered all U.S. Mastercard cardholders, with a global rollout planned for early 2026. As we tracked in our October 2025 news flow analysis and 4Q25 Earnings Review, Miebach stated plainly on the earnings call that Agent Commerce "will come fast," and Mastercard intends to be at the table.
Commercial and new payment flows represent the largest incremental addressable market. Virtual Card Number (VCN) solutions are gaining traction rapidly — by year-end 2025, virtual card technology was embedded in more than 10 global B2B and travel expense platforms, double the figure from 2024. The Mastercard Move platform covers over 17 billion global payment endpoints across 60+ origination countries and 155 receiving countries for remittances and disbursements. Behind these numbers lies a deliberate expansion from the "comfort zone" of consumer payments into the more complex, more fragmented domains of enterprise payments, bill payments, and cross-border remittances.
Stablecoins: Actions Speak Louder Than Words
The 10-K's competitive landscape section devotes considerable space to digital currencies. The GENIUS Act became the first major piece of U.S. crypto legislation in 2025, establishing a regulatory framework for stablecoins. Mastercard's language is carefully balanced — it lists stablecoins and digital assets as both an "opportunity" and a "potential competitive threat."
But the corporate body language tells a more candid story.
The company already enables spending of crypto and stablecoin assets across the Mastercard acceptance network through approximately 130 crypto co-branded card programs, and has embedded stablecoin support into the Mastercard Move platform. As we explored in detail in our October analysis, both Mastercard and Coinbase held advanced talks to acquire stablecoin payment startup BVNK, with valuations reportedly ranging from $1.5 billion to $2.5 billion. While management struck a tone of "cautious optimism" about the stablecoin threat on analyst calls, the willingness to deploy billions on acquiring a potential disruptor is the real strategic signal — if you can't kill it, acquire it.
This is textbook offensive defense. Mastercard is working to ensure that even if the underlying payment rails undergo a fundamental shift, it remains an indispensable infrastructure layer.
Financial Portrait: High Leverage, High Returns, High Cash Flow
Mastercard's balance sheet embodies the classic asset-light, high-leverage profile. Total assets stand at $54.2 billion, with goodwill and intangible assets accounting for $15.1 billion, or roughly 28% of the total. Total debt is $19.0 billion. Total equity is just $7.7 billion, producing a debt-to-equity ratio of approximately 2.5x. Treasury stock has accumulated to negative $83.2 billion — far exceeding retained earnings of $85.0 billion — the indelible footprint of years of aggressive share repurchases.
Yet this capital structure looks entirely at ease when set against the cash flow statement. FY2025 operating cash flow reached $17.6 billion, with a three-year compound annual growth rate of approximately 21%. Free cash flow of roughly $16.4 billion (after $1.2 billion in capital expenditures) comfortably funded $14.5 billion in total shareholder returns — $11.7 billion in buybacks plus $2.8 billion in dividends. The company also maintains $16.0 billion in backup liquidity ($8.0 billion commercial paper program plus $8.0 billion revolving credit facility), entirely undrawn.
Over the full year, Mastercard repurchased 21.1 million shares at an average price of $555.78 — up from $475.35 in 2024 and $379.49 in 2023. The buyback machine is accelerating, and buying at progressively higher prices. In December 2025, the Board approved a new $14.0 billion repurchase authorization (up from $12.0 billion in 2024), leaving $17.5 billion of remaining capacity at year-end.
Per-share dividends rose to $3.15, a 15% increase. Diluted EPS grew from $11.83 to $16.52 over three years, a CAGR of approximately 18%, with share count reduction contributing roughly 3 percentage points of accretion.
Operating margin expanded from 55.3% in 2024 to 57.6%, with the adjusted figure reaching 59.2%. Adjusted expense growth of 14% ran slightly below adjusted revenue growth of 15%, generating modest but steady operating leverage.
Cracks in the Tax Shield: Pillar 2's Structural Impact
If the flywheel represents the exhilarating side of the Mastercard story, the Pillar 2 global minimum tax is the structural headwind that demands the most attention.
The effective tax rate leapt from 15.6% to 19.4% — an increase of 3.8 percentage points. The primary cause is straightforward: Singapore began enforcing the OECD Pillar 2 framework on January 1, 2025, implementing a 15% global minimum tax rate. This directly generated $233 million in incremental tax expense, while simultaneously reducing the benefit from Singapore tax incentives from $644 million in 2024 to $330 million in 2025.
To frame this differently: in 2024, Singapore tax incentives contributed -4.2 percentage points to the effective tax rate. In 2025, that benefit shrank to -1.8 points. Pillar 2 then added another +1.3 points on top. Combined, the tax rate impact from Singapore alone deteriorated by approximately 3.7 percentage points.
This is not a one-time event. Singapore's new tax incentive arrangement runs through December 31, 2029, meaning Mastercard will continue to benefit from some level of preferential treatment — but far less than before. Investors should recalibrate around a 19–20% effective tax rate as the new structural baseline, rather than extrapolating from the 15–16% levels of recent years.
The profit drag is material. Had the FY2025 effective tax rate remained at 2024's 15.6%, net income would have been approximately $700 million higher. That is roughly 5% of net income — consumed by Pillar 2.
The Siege: Regulation, Litigation, and Competition
The risk factors section of this 10-K reads like a threat map of the global payments industry.
Interchange fee litigation is the single largest unresolved risk. The U.S. Multidistrict Litigation (MDL), which originated in 2005, has now spanned two decades. The encouraging news: by year-end 2025, between the Damages Class settlement and agreements reached with the majority of opt-out merchants, coverage exceeded 90% of Mastercard's U.S. interchange volume. The less encouraging news: among the remaining opt-out merchants, seven — including Circle K — continue to claim individual damages in excess of $1 billion, with trials scheduled for April and September 2026. The company has accrued $637 million in litigation reserves.
Across the Atlantic, litigation proceeds on multiple fronts. A UK commercial card class action claims exceed GBP 1 billion (approximately $1.3 billion). A Portuguese consumer class action seeks approximately EUR 400 million. A Dutch merchant class action filed in July 2025 claims over EUR 300 million. Multi-jurisdictional, multi-threaded litigation has become the permanent backdrop.
Regulatory tightening represents a more structural form of pressure. Brazil's central bank established new regulations for all payment scheme operators — including Mastercard and Visa — in November 2025, requiring the extension of settlement guarantees to previously uncovered merchant installment transactions. In the United States, two federal district courts issued contradictory rulings on Durbin Amendment-related interchange fee caps in August and September 2025 — one vacating the cap, the other upholding it. Meanwhile, a DOJ civil investigation and a European Commission inquiry into network fee-related acquirer practices continue to advance.
As we analyzed at length in A Tale of Two Headwinds, the Credit Card Competition Act (CCCA) — if enacted — would require large card-issuing banks to offer at least two unaffiliated payment networks on every credit card. Morgan Stanley's scenario analysis estimates that under a pessimistic assumption of 10% volume migration and 25% fee pressure, the revenue impact on Mastercard would be approximately 2.5% — manageable, but not negligible.
The competitive landscape is evolving along several dimensions the 10-K flags as worthy of vigilance. Real-time account-based payment systems — Brazil's PIX, the U.S. FedNow, India's UPI — are encroaching on traditional card networks' domestic transaction share. Digital Public Infrastructure (DPI) is gaining government backing in emerging markets. And Capital One has announced plans to begin issuing new cards on the Discover network starting mid-2026, with the intention of migrating its credit card portfolio to Discover by early 2027. As we noted in our 4Q25 Earnings Review, J.P. Morgan estimates this exposure at roughly 15–20% of Mastercard's volume, or approximately $70 billion in transactions.
At the same time, Mastercard won an important defensive battle in the United States. As we covered in A Costly Education: Apple's Pivot from Banking Dream to Financial Reality, Visa reportedly offered around $100 million to wrest the Apple Card's network service contract away from Mastercard — and failed. Mastercard retained its position as Apple Card's exclusive network provider.
Five-Year Shareholder Returns: An Uncomfortable Truth
The 10-K includes a chart that warrants a moment of reflection.
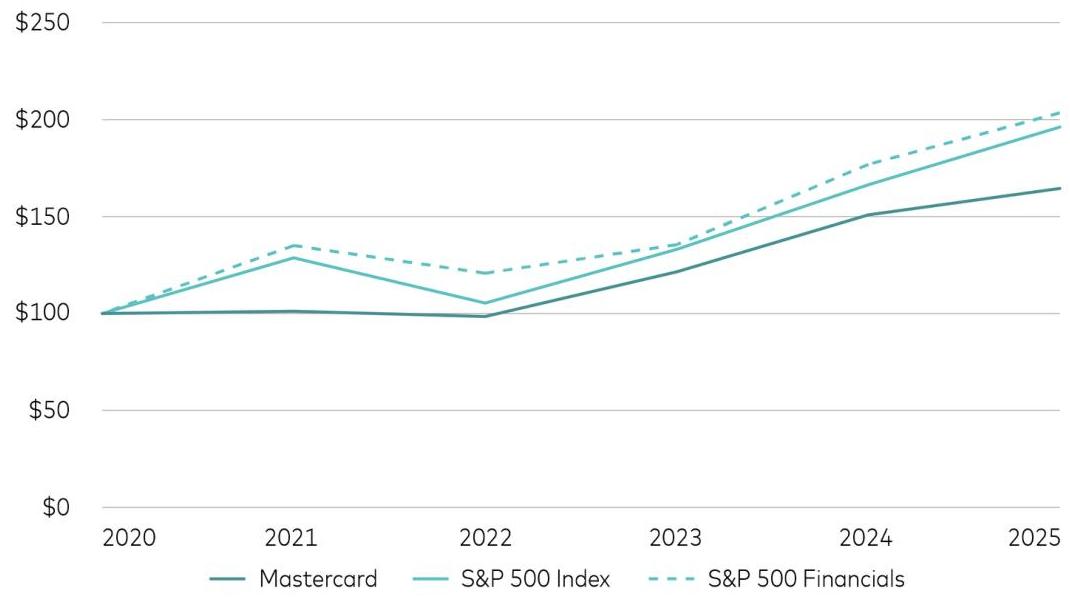
Mastercard Five-Year Cumulative Total Shareholder Return (2020–2025)
source: Mastercard FY2025 10-K
Using a $100 baseline in 2020, Mastercard's five-year cumulative total return came in at $164.50. By comparison, the S&P 500 delivered $196.16 and S&P 500 Financials reached $203.47.
A company with operating margins approaching 60%, three-year EPS CAGR of 18%, and returning over 80% of operating cash flow to shareholders annually — and it underperformed both the broader market and the financials sector over five years. In 2022, Mastercard briefly dipped to $98.47, while S&P 500 Financials held above $120.
This does not signal a fundamental problem with the business. It more likely reflects the starting-point effect of valuation — Mastercard entered 2020 as a richly valued growth stock, then absorbed the collective re-rating that rising interest rates inflicted on high-multiple companies throughout 2021–2022. From 2023 to 2025, the stock has recovered steadily, but at a slower pace than the broader financials index.
For long-term investors, this chart serves as a useful reminder: an exceptional business model does not guarantee an exceptional entry price at any given moment. At current valuation levels, distinguishing between the quality of growth and the quantity of growth — as we emphasized in our 4Q25 review — remains an essential discipline.
The Flywheel Versus Gravity
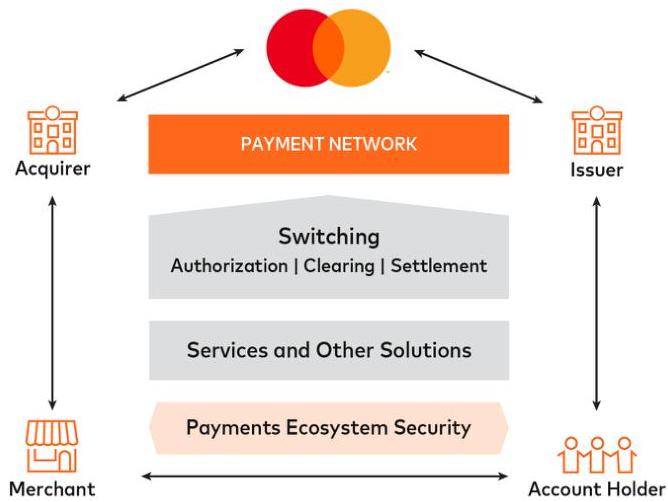
After reading Mastercard's FY2025 10-K cover to cover, it is difficult not to respect the business model. The network effects of the four-party system, the self-reinforcing dynamics of the VAS flywheel, the structural tailwind of cross-border payments, the forward positioning in tokenization and Agent Pay — these constitute a competitive moat that is, for the moment, nearly unmatched in global payments.
Mastercard's Four-Party Payment Network
source: Mastercard FY2025 10-K
But the annual report is equally honest about the headwinds. Pillar 2 has permanently raised the effective tax rate by roughly 4 percentage points. Interchange fee litigation has spanned two decades and is far from over. Stablecoins and real-time payment systems are challenging the fundamental necessity of the four-party model from the ground up. Capital One's migration to Discover will materially affect U.S. market share over the next 18 months.
The real question is not whether Mastercard is a good company — the answer is self-evident. The real question is whether, with VAS growing at 23%, cross-border volumes expanding at 15%, and Agent Pay rolling out globally, the centrifugal force of the flywheel is sufficient to overcome the gravitational pull of Pillar 2 taxes, a regulatory siege, and competitive substitution.
A good 10-K doesn't hand you the answer. It equips you to ask the right questions.
Source: Mastercard FY2025 10-K


