
Synopsys 3Q26 Review: The Beat Was Real, the Multiple Came Down Anyway
Synopsys beat on revenue, EPS and margin, and raised its full-year outlook. The same morning, every bank that published a target price raised its earnings estimates and cut its multiple anyway. What did they stop paying for?*


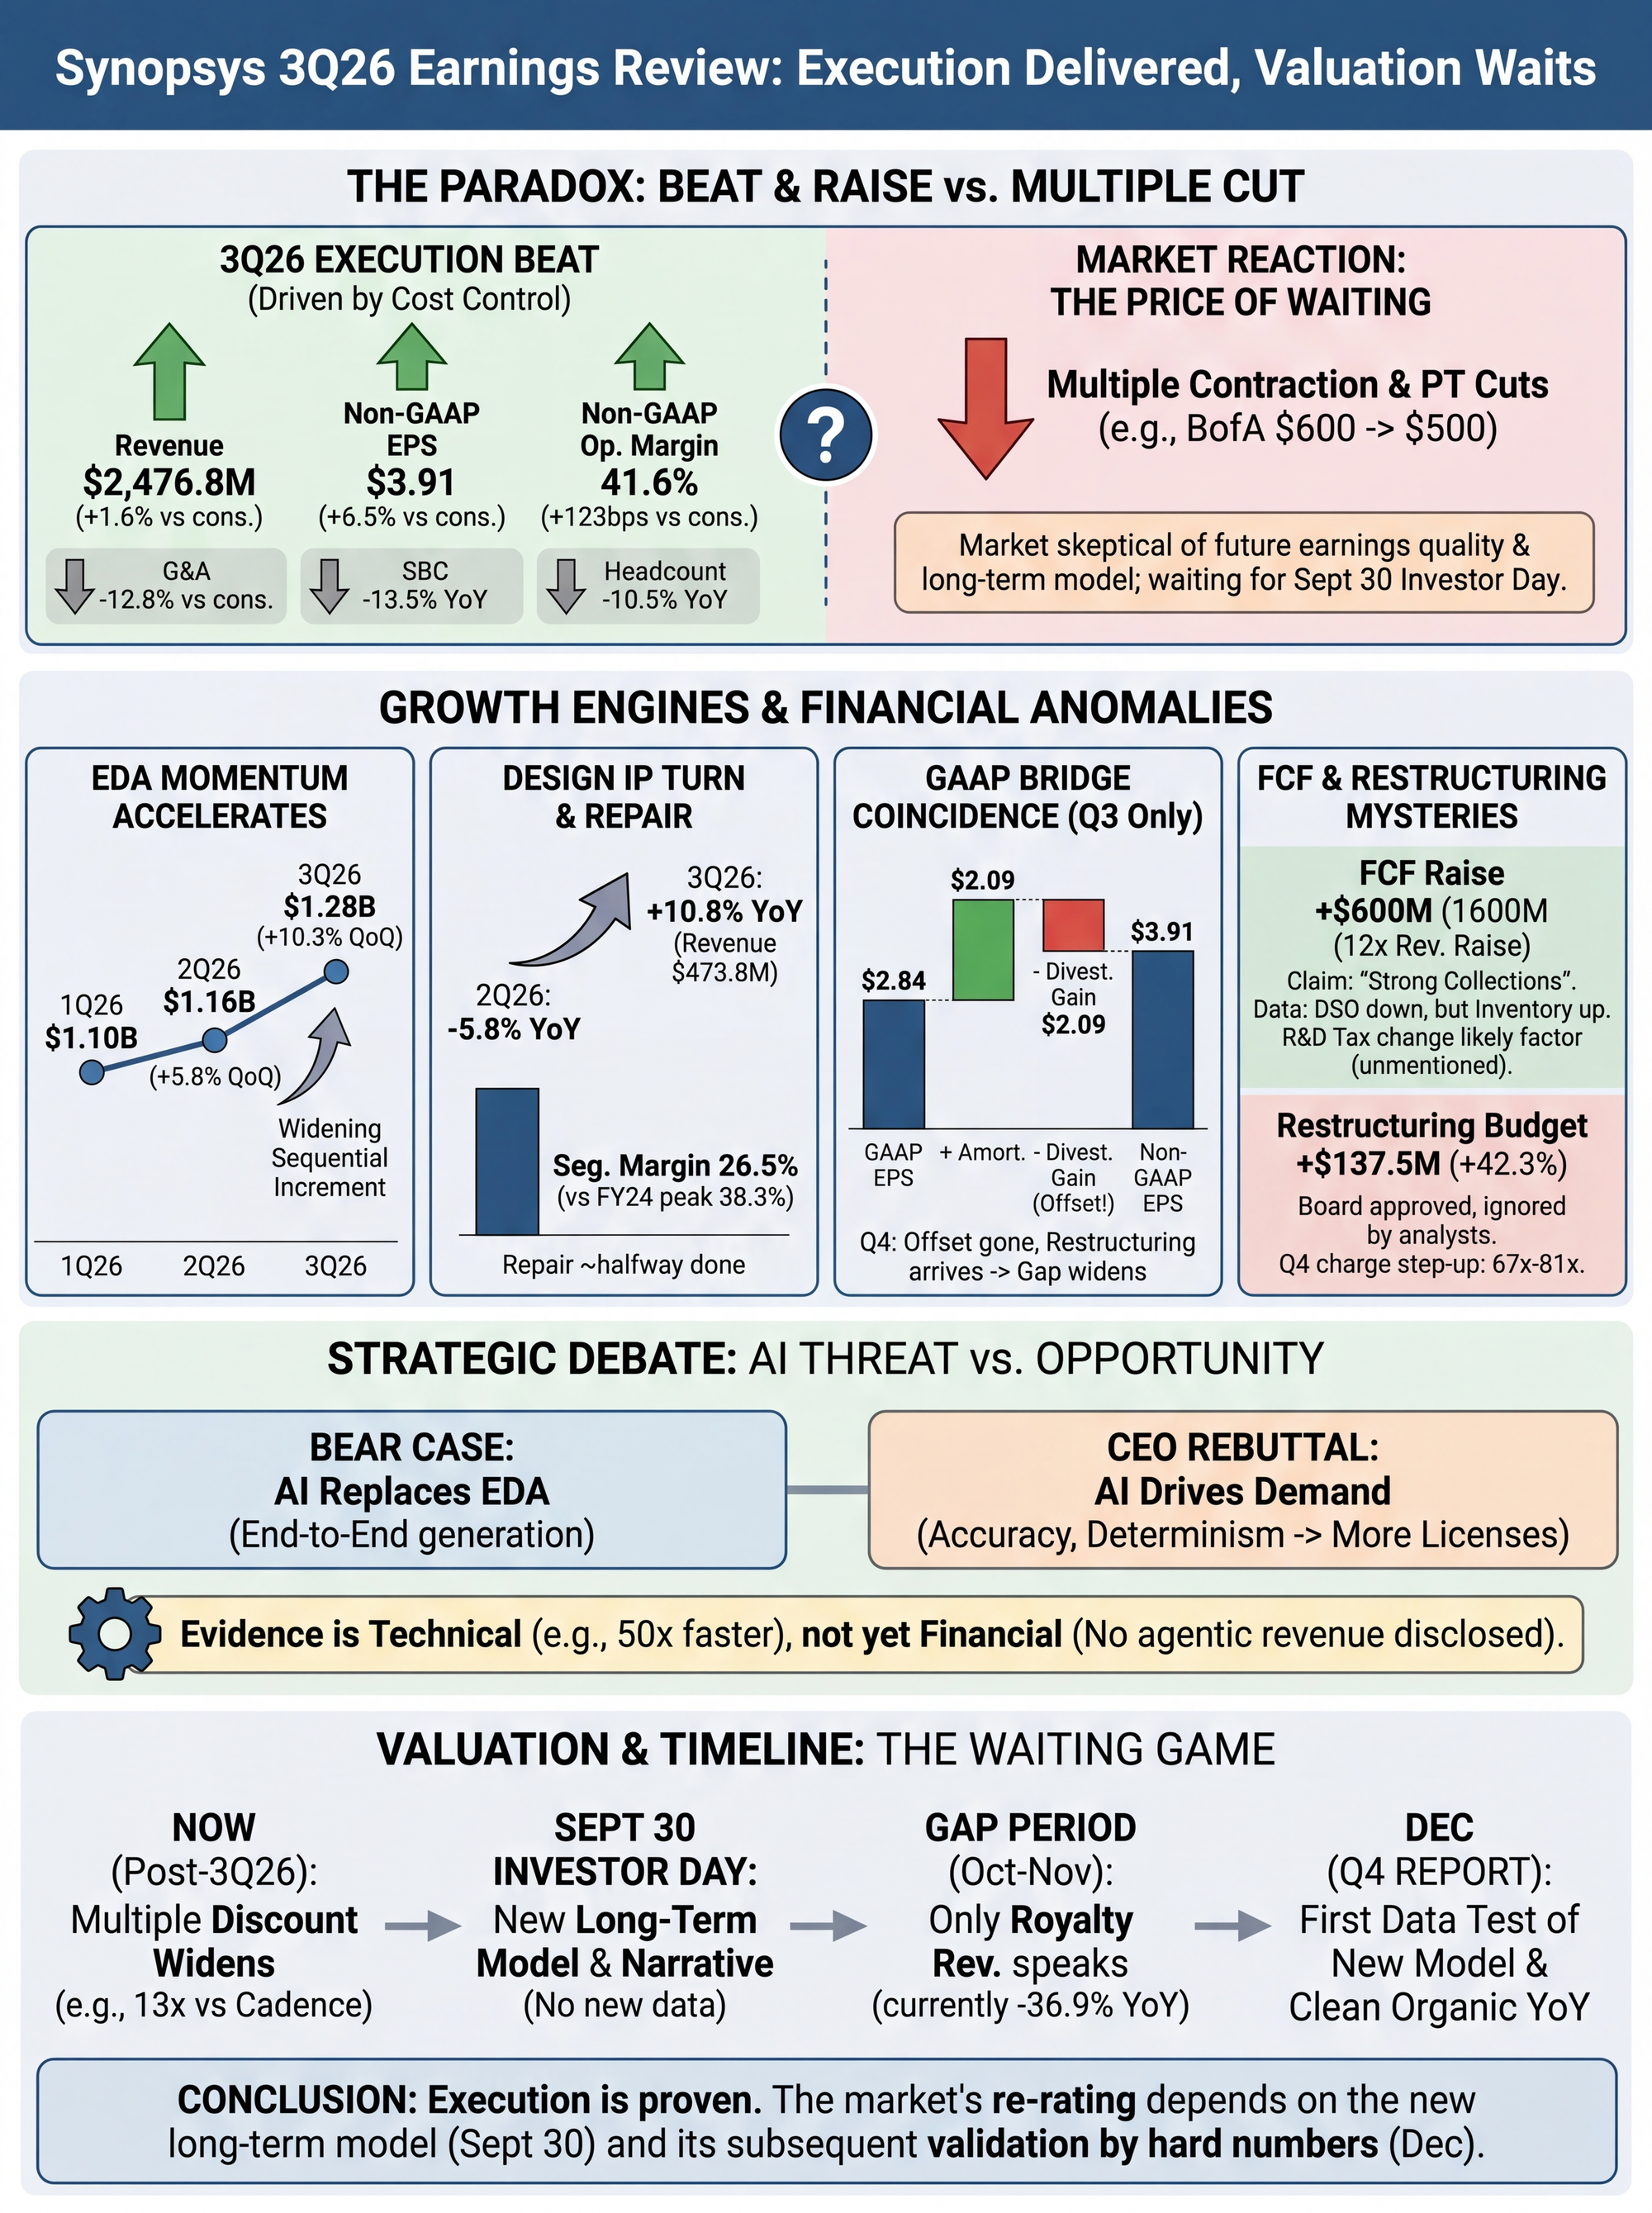
Synopsys 3Q26 Earnings Review: Growth Delivered Half an Answer, and the Wait Now Has a Price
Last quarter I titled my Synopsys review Value Capture: A Word Still Waiting for Its Number. The closing line was that until September 30, it remains a word with no number filled in yet.
Three months on, Synopsys has delivered a quarter that beat on very nearly every line. The number still hasn't arrived.
Start with two official figures. The company lifted the midpoint of its FY26 revenue guidance from \$9,665mn to \$9,715mn, a \$50mn increase. But the quarter itself came in \$41.8mn above the guidance midpoint. Subtract one from the other and the implied raise left for the fourth quarter is roughly \$8mn, less than 17% of the full-year increase.
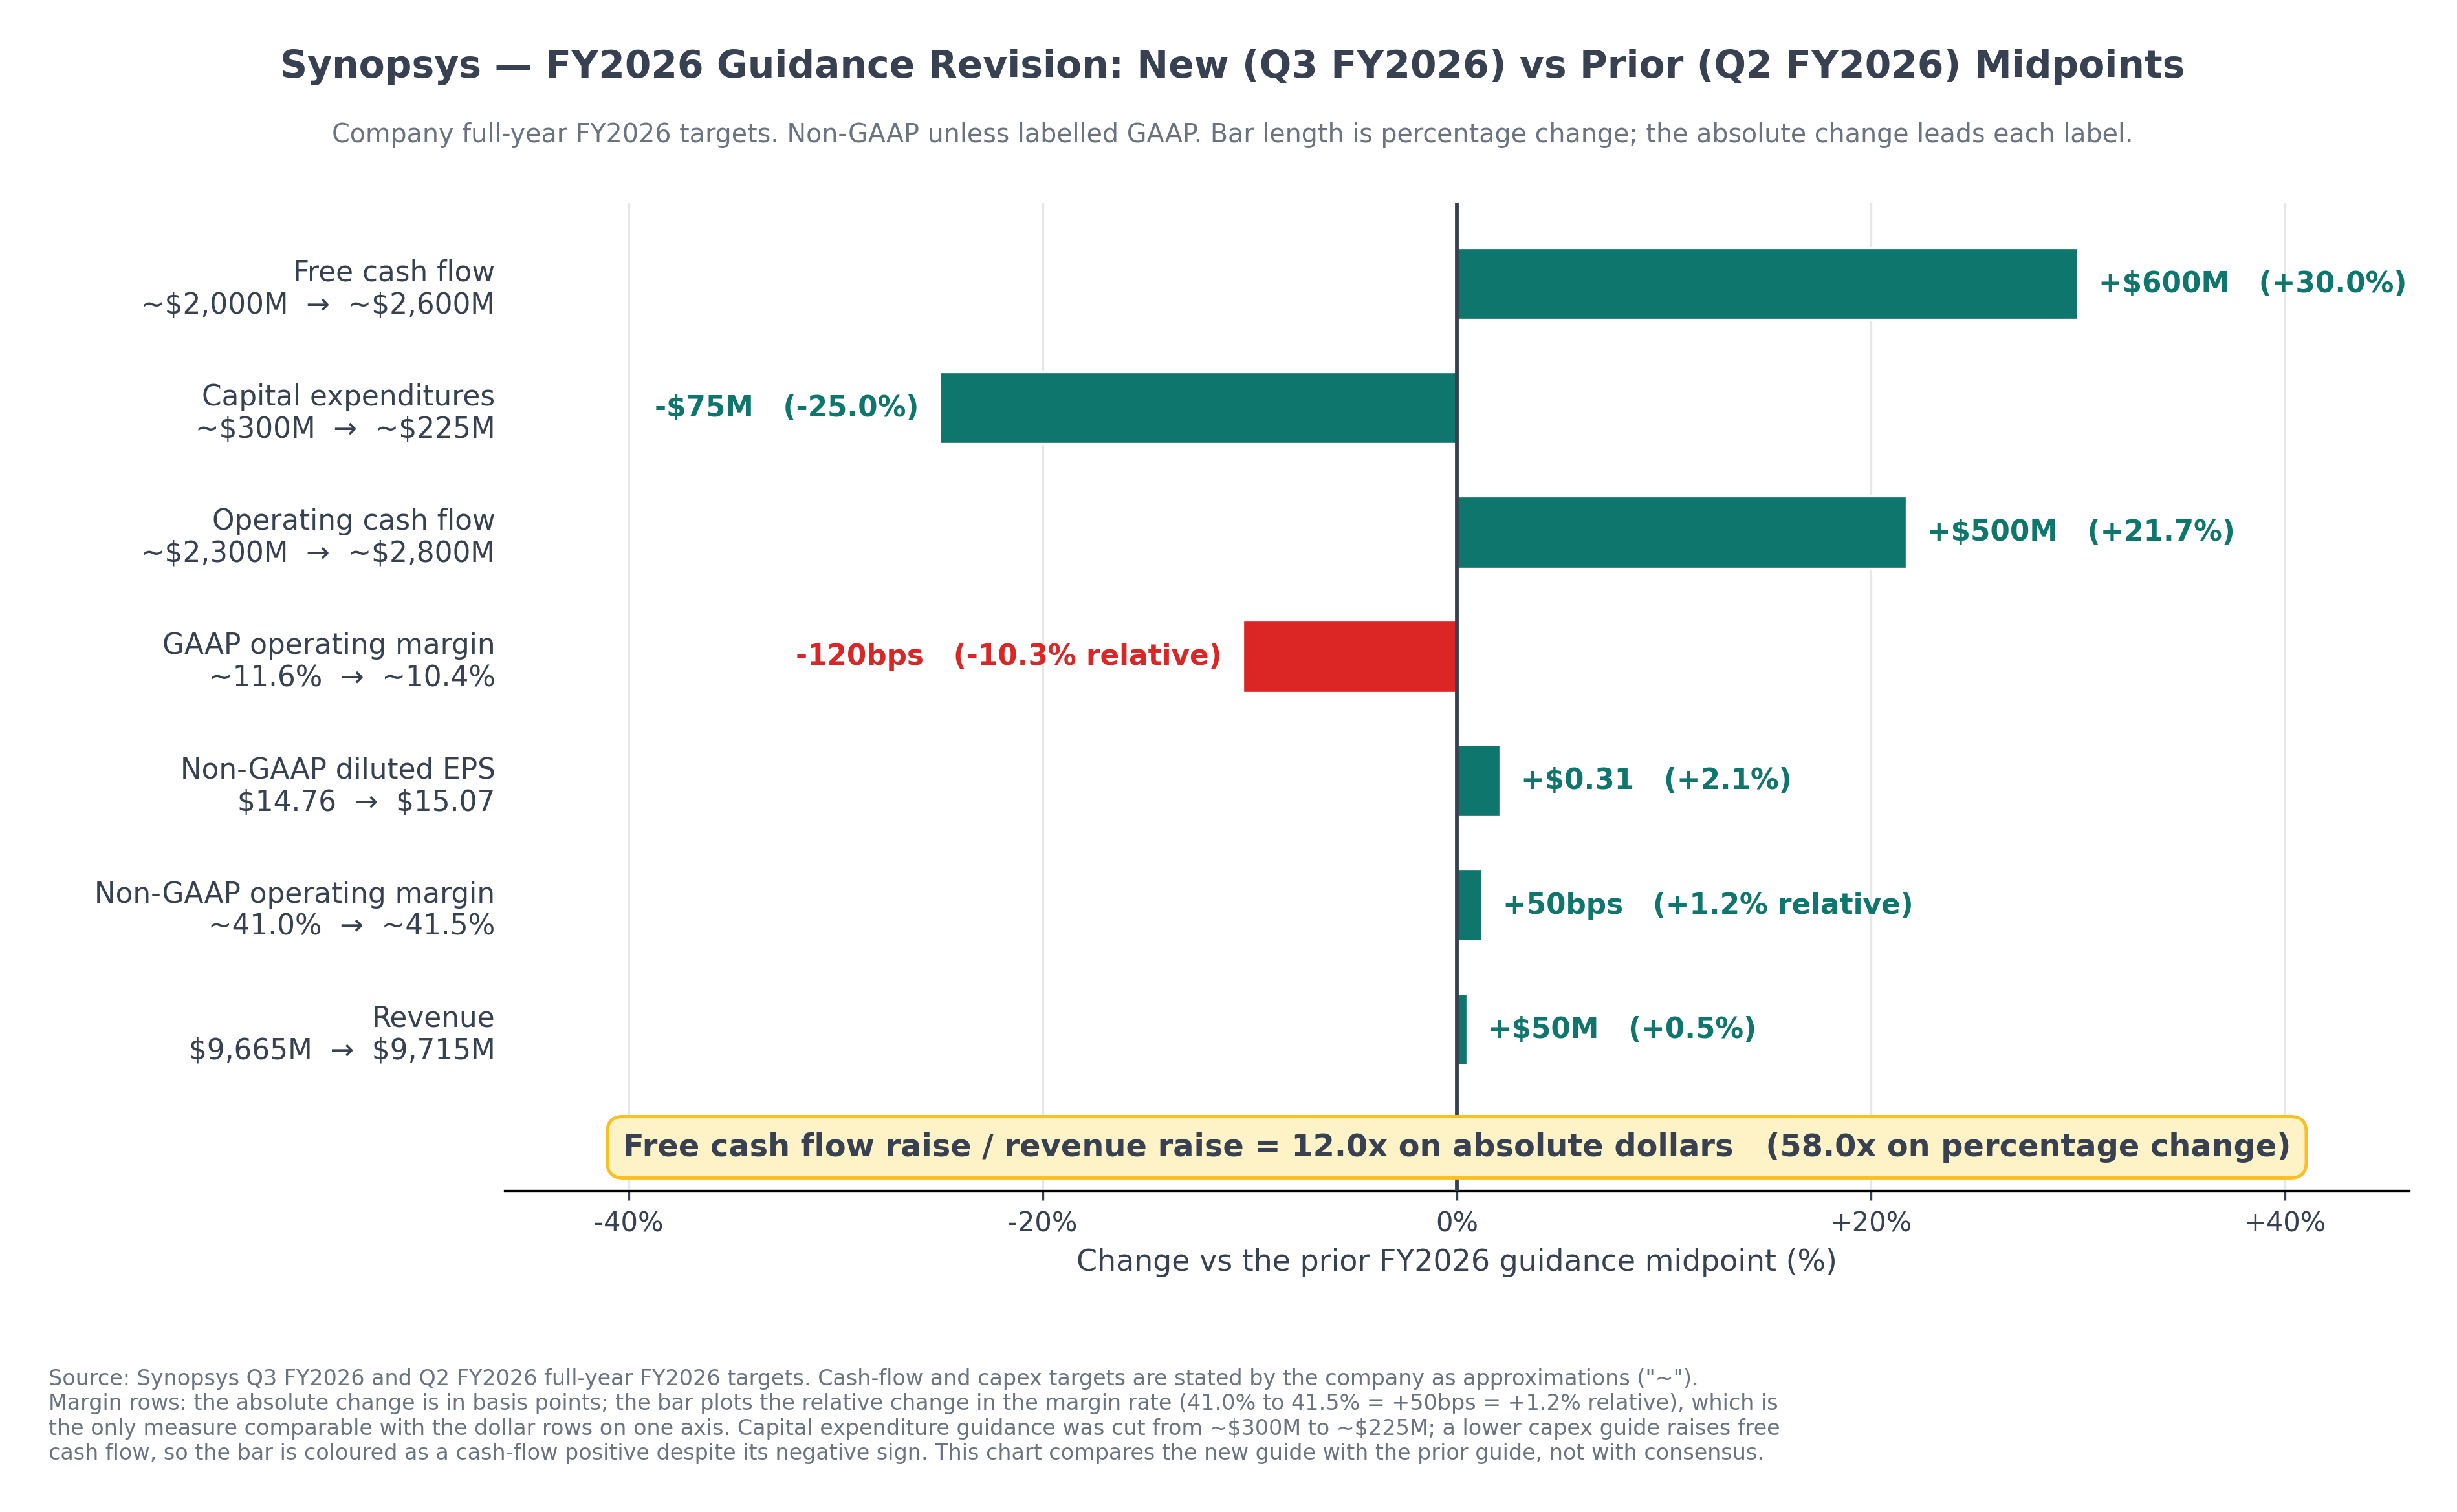
In the same guidance, free cash flow went from about \$2,000mn to about \$2,600mn. A $600mn raise.
These two numbers are not on the same scale.
And on the day of the print, the three banks that published price targets moved in two opposite directions at once: up on their earnings estimates for the next two to three years, down on the multiple they were willing to apply. BofA cut its target from \$600 to $500.
What deserves an analyst's time this quarter is the relationship between those three facts, not the size of the beat.
I. Winning on the Same Ground as Always
Look first at the shape of the beat.
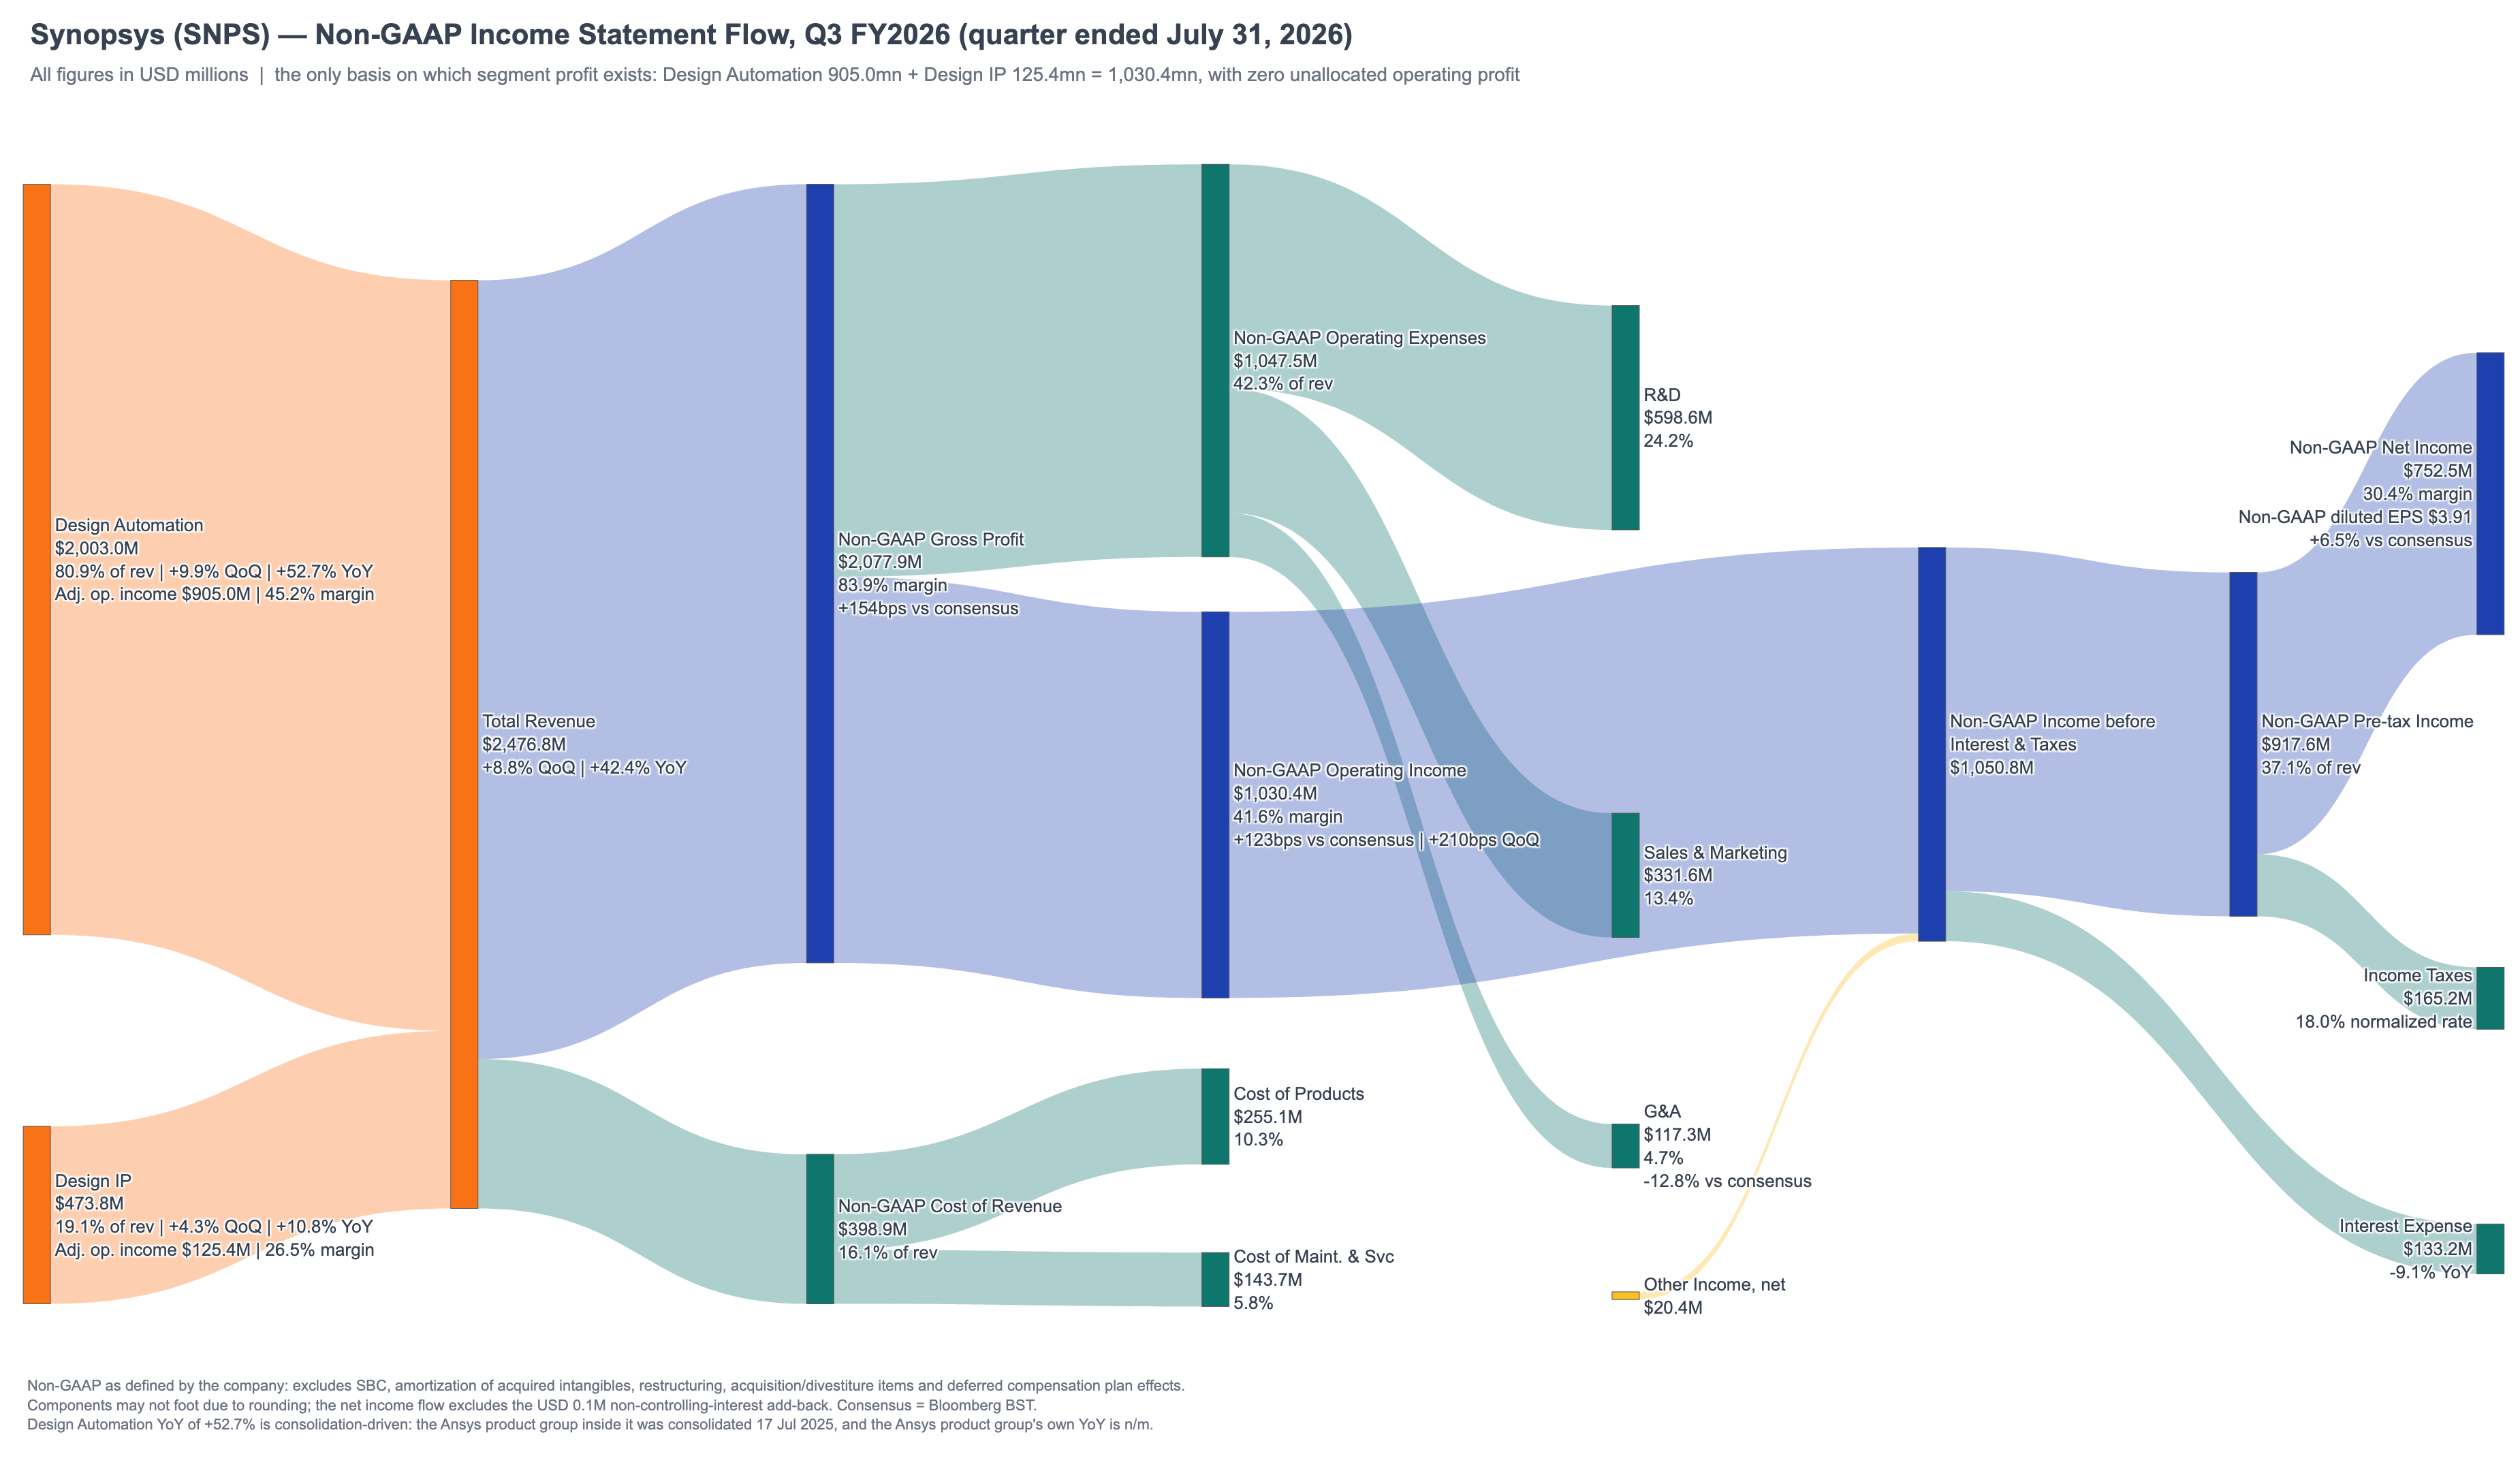
Revenue of \$2,476.8mn came in 1.6% above consensus. Non-GAAP EPS of $3.91 beat by 6.5%. Non-GAAP operating margin of 41.6% cleared consensus by 123 basis points. All three landed above the top end of the company's own guidance range.
The margin beat was wider than the revenue beat. I drew that same shape in the 2Q26 piece. Here it is again.
Non-GAAP income statement flow: segment profit only exists on this basis
Source: Synopsys 3Q26 Form 10-Q, Financial Supplement and segment disclosure; compiled by the author
Follow the chart to the right and the expense side gives a concentrated answer. Non-GAAP G&A was just \$117.3mn, 4.7% of revenue and 12.8% below consensus, the single largest contributor to the margin beat. R&D of \$598.6mn came in essentially in line. Stock-based compensation of \$231.6mn fell 13.5% year-over-year in a quarter when revenue rose 42.4%. Headcount dropped to roughly 25,345, down 10.5% year-over-year and 2,985 below the peak in the quarter Ansys was consolidated.
One cluster of numbers says more about the character of this beat than any of the above. Four sell-side EPS estimates for the quarter clustered between \$3.66 and $3.68, a dispersion of under 1%, and all four were pierced in the same direction by more than 6%. Four independent models understating the same line by the same margin tells you the sell-side's ability to model the cost side has fallen behind this company's execution speed.
II. This Time, Growth Turned In Half an Answer Too
The 1Q26 piece was titled Proved the Margins, Now Prove the Growth. 2Q26 handed back half of that answer. This quarter, growth finally responded directly.
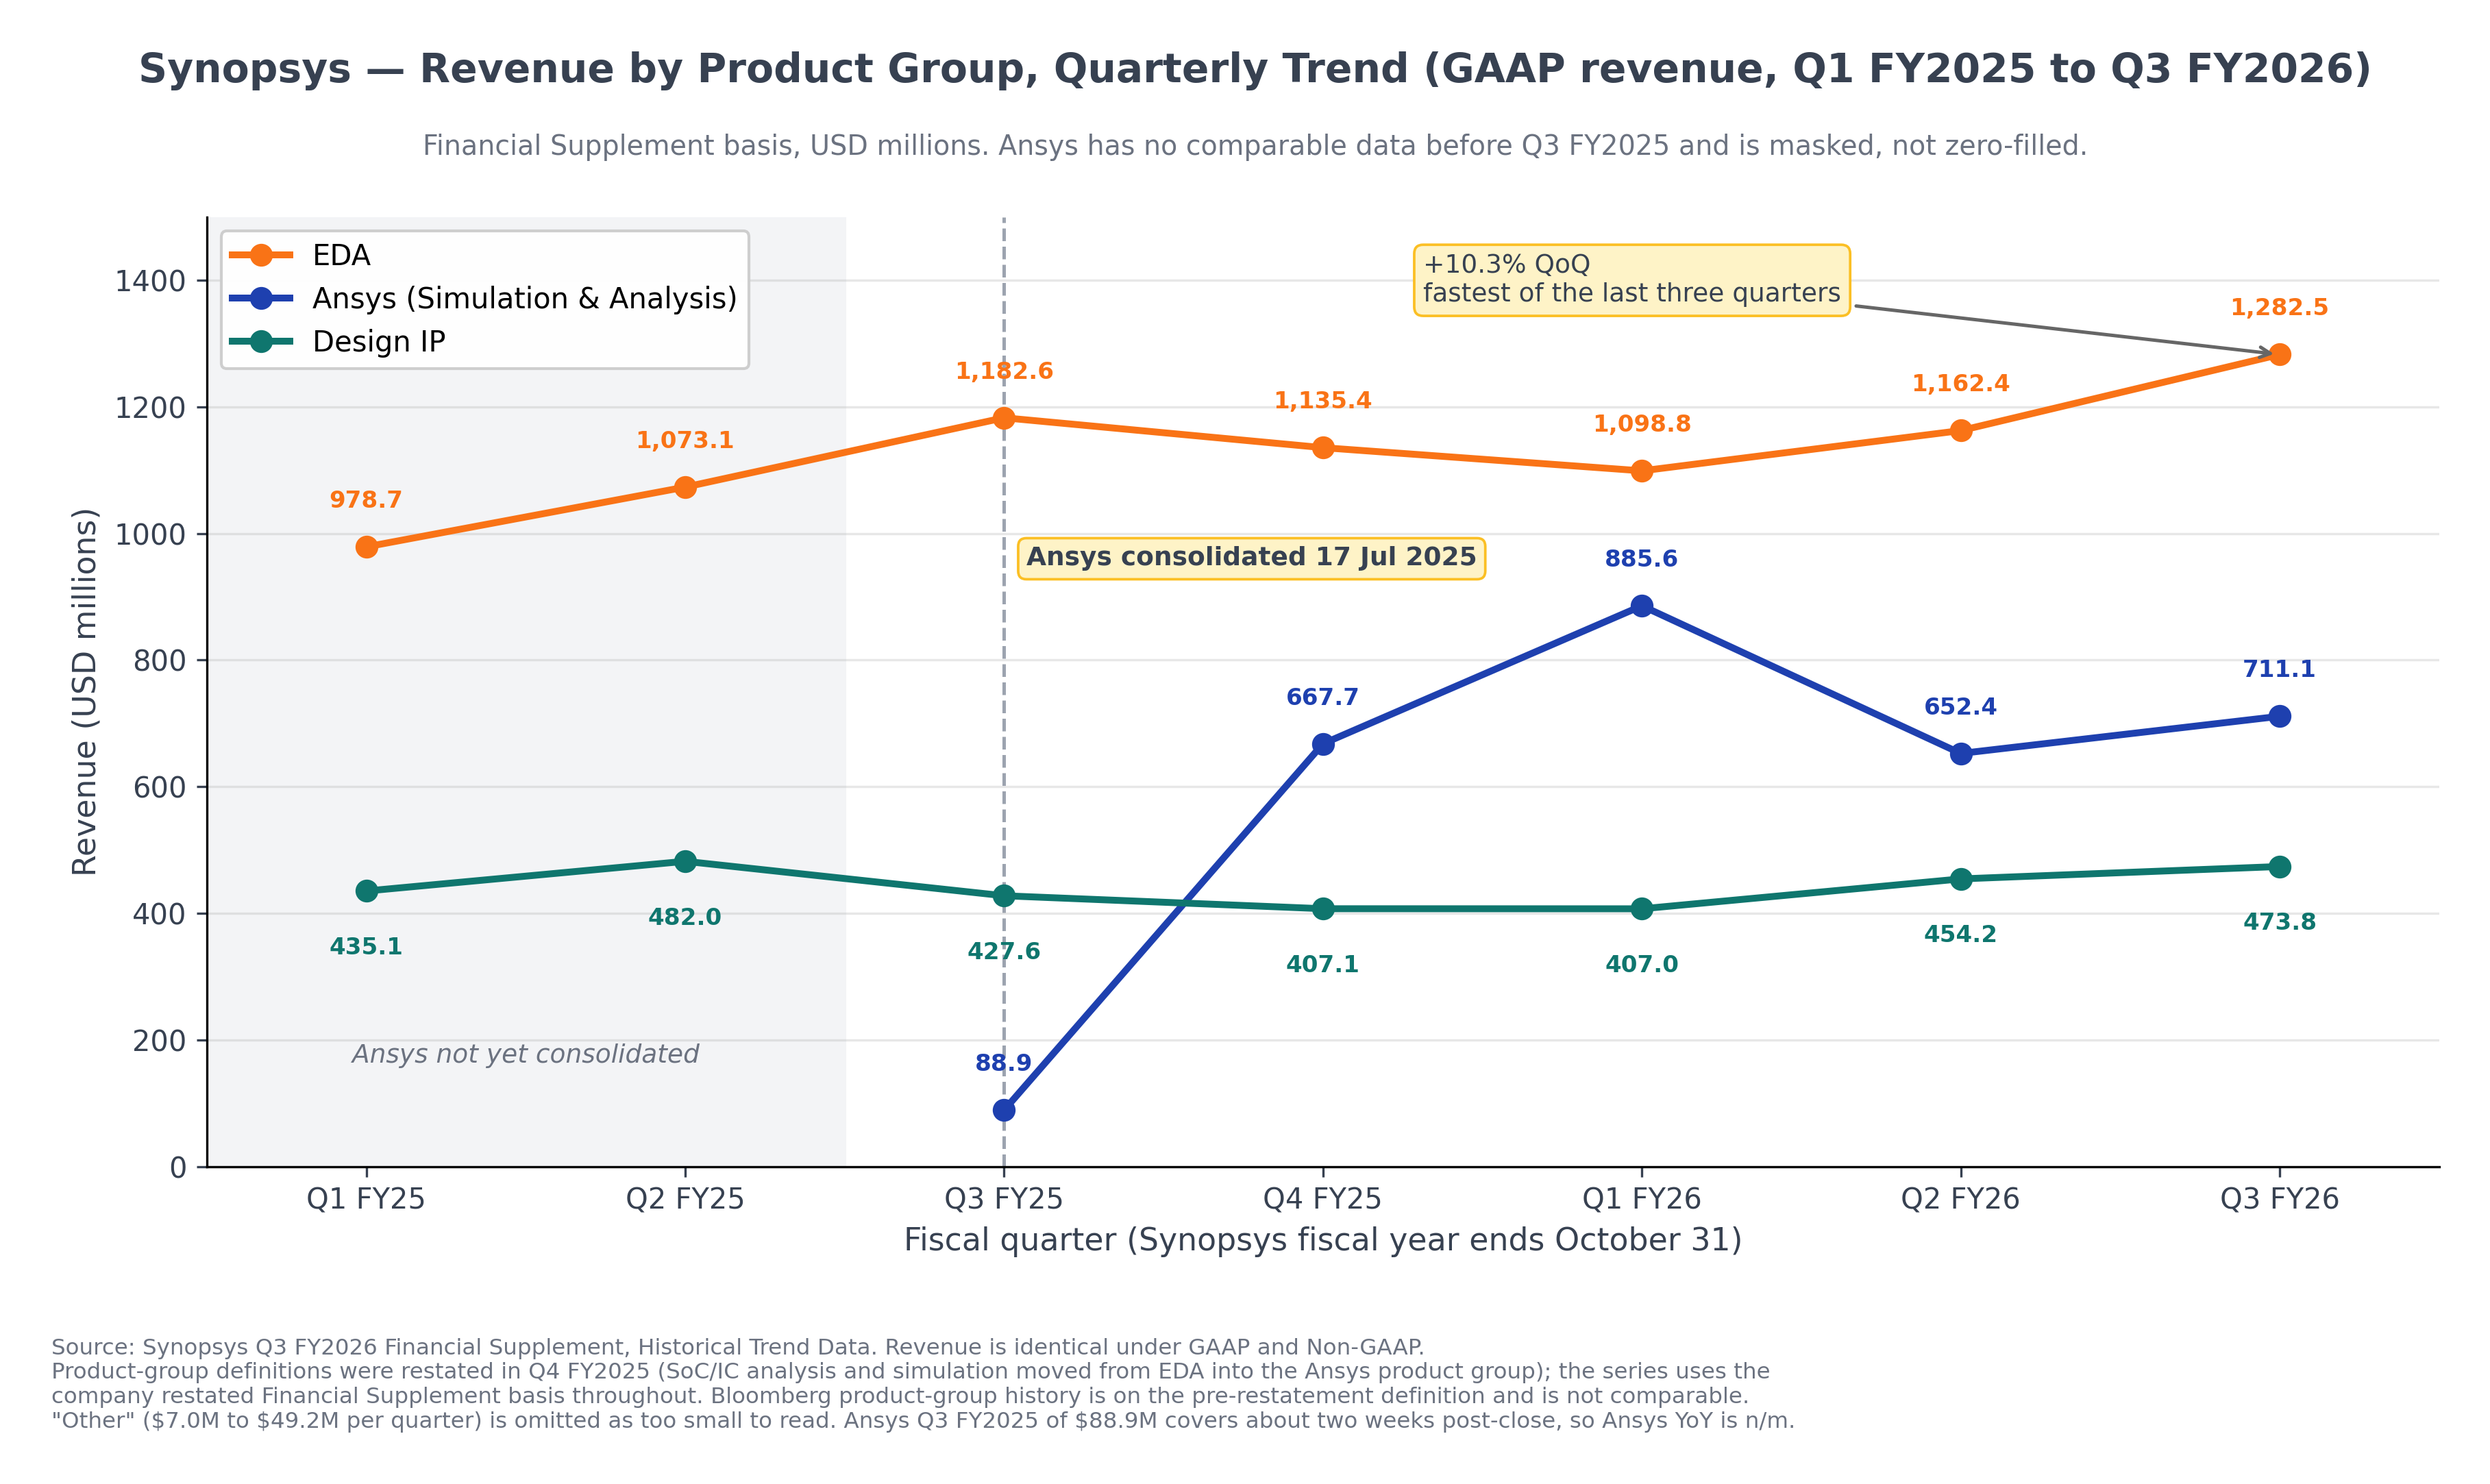
Product group revenue by quarter: EDA momentum is building
Source: Synopsys 3Q26 Financial Supplement, historical trend data; compiled by the author
The EDA sequence runs \$1,098.8mn in 1Q26, \$1,162.4mn in 2Q26 (up 5.8% sequentially), and \$1,282.5mn this quarter (up 10.3%). The sequential increment has widened three quarters running. Year-over-year growth of 8.4% was set against a 16% comparison base. Design IP revenue of \$473.8mn grew 10.8% year-over-year, against a decline of 5.8% only one quarter ago.
Two qualifications have to travel with that.
The first is arithmetic. Management committed to double-digit organic EDA growth for Q4 and the full year, and the bar is considerably lower than the debate on the call implied. Working from the FY25 base and nine-month cumulative revenue, EDA clears 10% for the year as long as Q4 falls no more than 1.5% sequentially; flat sequential delivers 10.5%. Goldman Sachs's full-year model implies Q4 almost exactly flat. BofA implies up 3.0%. Two different routes, one conclusion: double digits is already in the models. When it lands, it will not be upside. It will be the absence of failure.
The second is the annual view on Design IP. Alongside the return to year-over-year growth, nine-month cumulative revenue is still down 0.7% and nine-month adjusted operating income is down 16.8%. Segment margin has recovered from the 13.8% trough in 4Q25 to 26.5%, a climb of 1,270 basis points, and still sits 1,180 basis points below the 38.3% of FY24. The repair is a little over halfway done.
There is also an attribution worth writing down. The CFO credited the full-year raise to the Design Automation segment, "led by EDA." Yet the call also disclosed that the full-year Ansys revenue contribution had been lifted \$20mn from the prior guidance. That \$20mn is 40% of the \$50mn full-year raise, leaving \$30mn to be split between EDA and Design IP. Goldman Sachs's product-level variance analysis points the same way: revenue beat its model by \$18mn, of which Ansys accounted for \$46mn while EDA came in \$9mn light. Strip Ansys out and its model was \$29mn above the actual result.
Two independent pieces of evidence put Ansys's contribution this quarter well ahead of where the official narrative placed it.
III. A Coincidence on the GAAP Line That Disappears Next Quarter
On June 1, the company completed the sale of its Processor IP Solutions business to GlobalFoundries and booked a pre-tax gain of \$425.4mn. That gain represents 62.2% of the quarter's \$683.9mn of GAAP pre-tax income, and because the company determined the transaction was not a strategic shift with a major effect on operations, it was not presented as discontinued operations. It stays inside continuing operations on the GAAP statements permanently.
What makes it interesting is the coincidence it produced on a per-share basis.
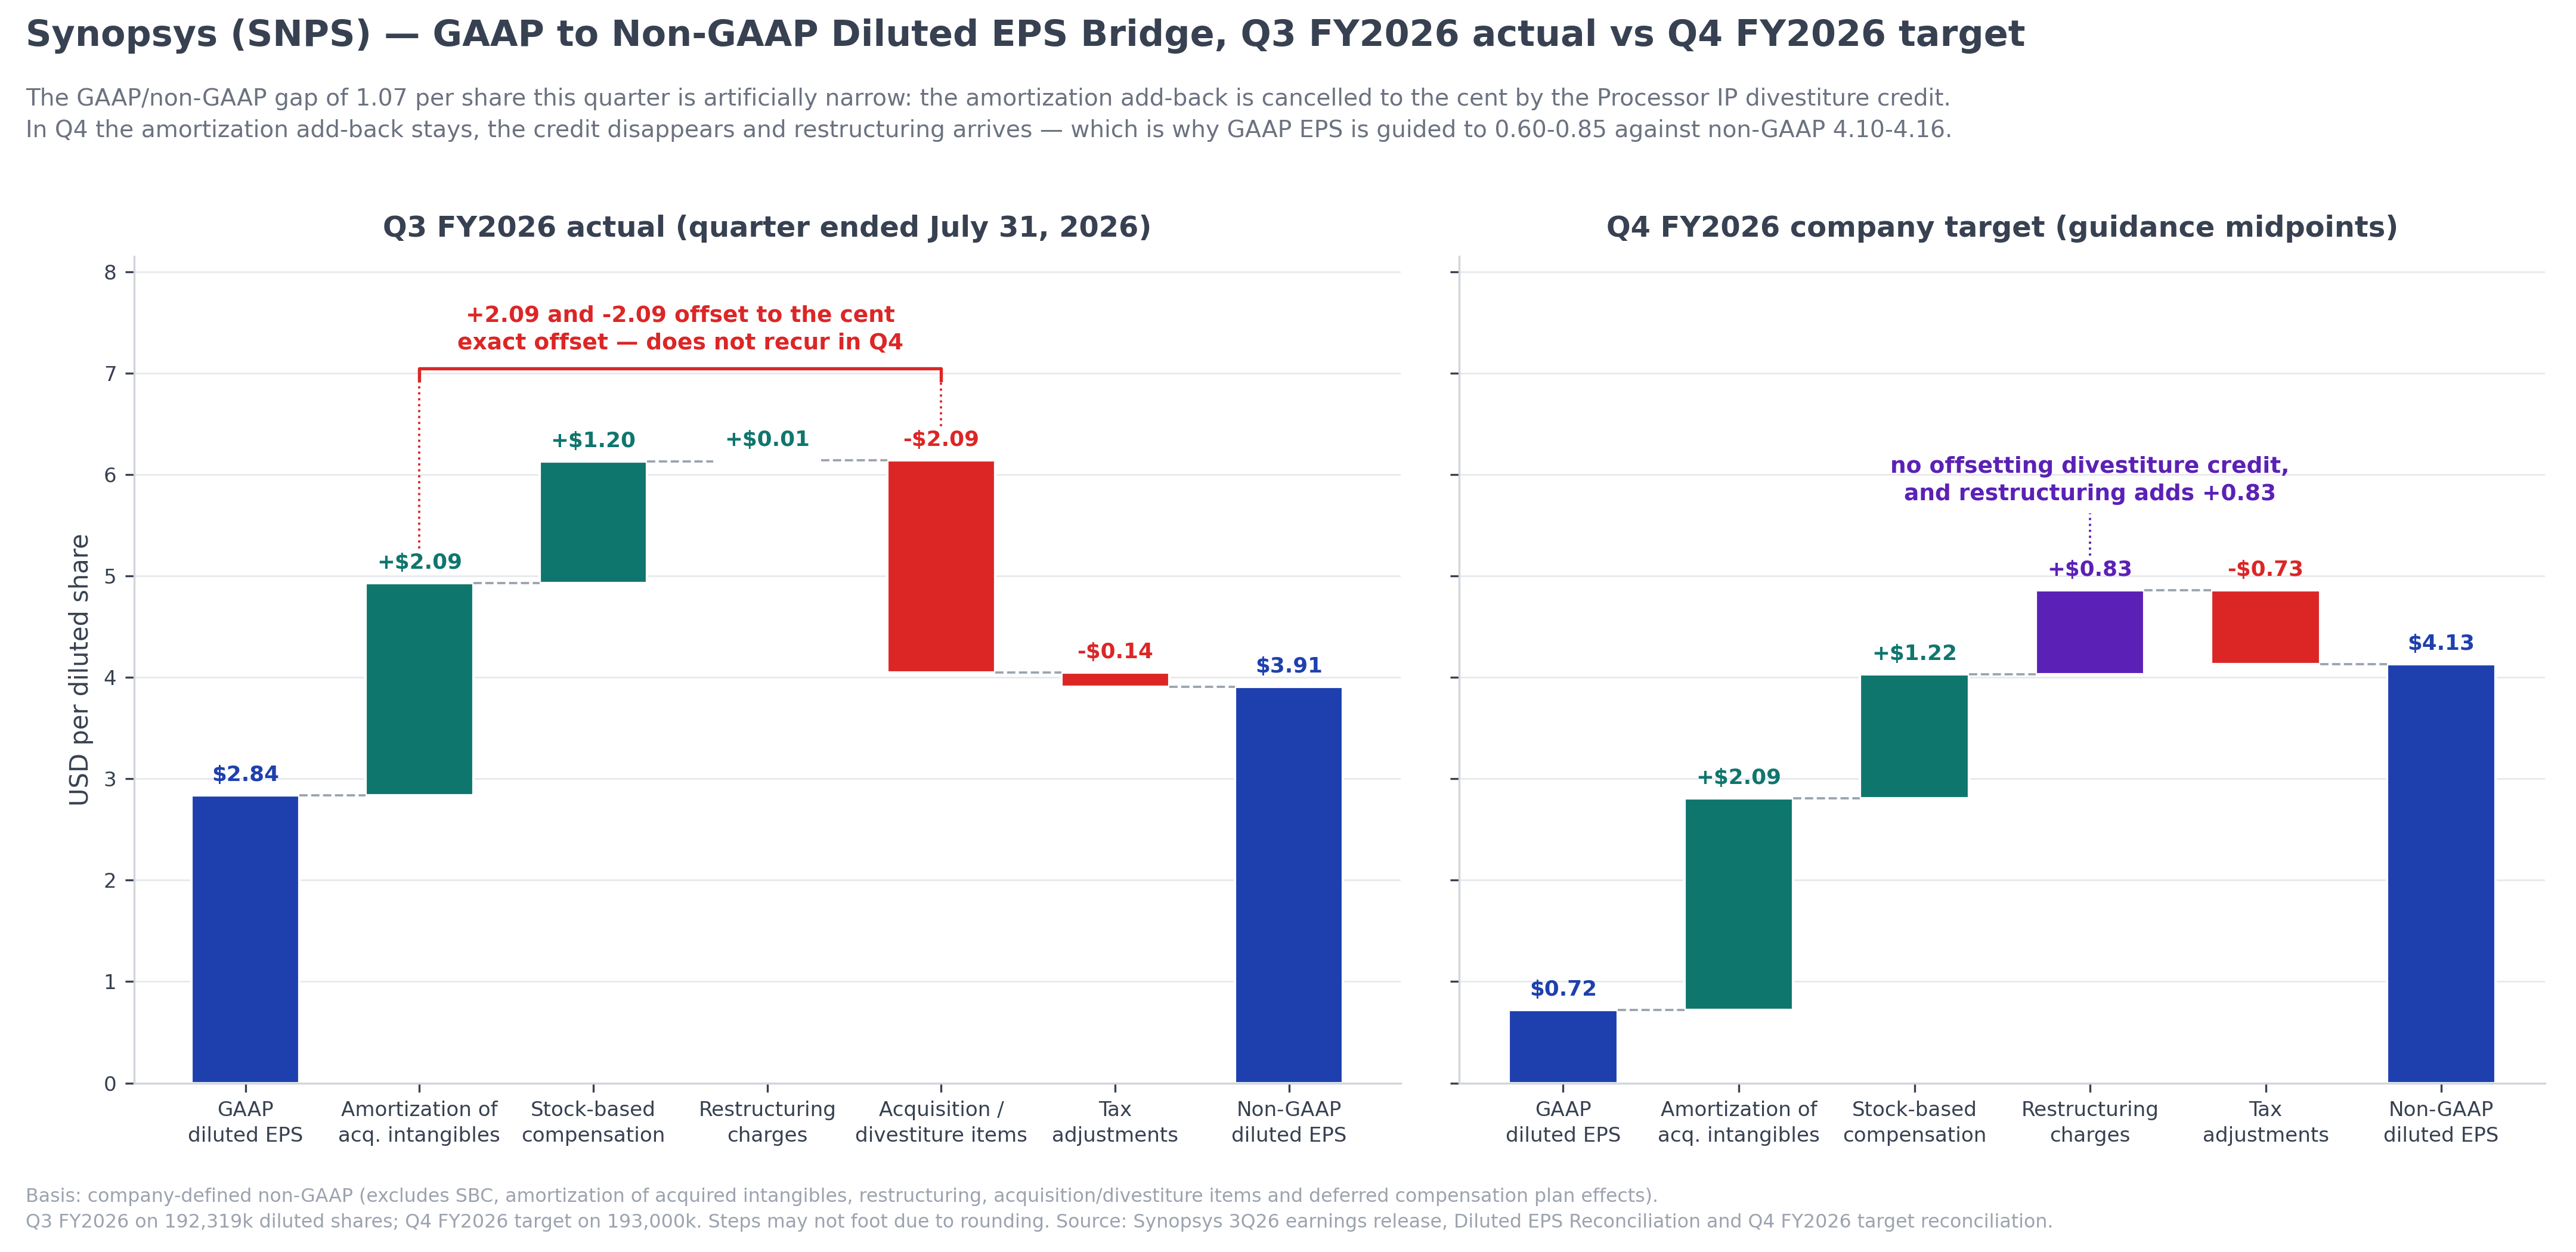
GAAP to non-GAAP diluted EPS bridge: this quarter's convergence is a coincidence, and it goes away next quarter
Source: Synopsys 3Q26 reconciliation tables and Q4 FY26 target reconciliation; compiled by the author
Look at the left panel. The add-back for amortization of acquired intangibles is \$2.09 per share. The acquisition and divestiture line, turned negative by the disposal gain, is \$2.09 per share the other way. They cancel to the cent. That is the entire arithmetic reason GAAP EPS of \$2.84 sits only \$1.07 below non-GAAP EPS of \$3.91.
The right panel shows the structure dissolving next quarter. The amortization add-back stays, the divestiture offset goes to zero, and restructuring arrives at \$0.83 per share. Which is why Q4 GAAP EPS is guided to \$0.60 to \$0.85 while non-GAAP is guided to \$4.10 to \$4.16.
All four sell-side reviews discussed non-GAAP only. Not one mentioned GAAP EPS. Reading this quarter's GAAP and non-GAAP convergence as an improvement in earnings quality is precisely the interpretation this chart rules out.
IV. Where the \$600mn Came From, and One Source Nobody Mentioned
Back to the gap in the opening. Free cash flow guidance went up \$600mn in a single revision, twelve times the size of the revenue raise, and the CFO's entire explanation ran to five words: strong collections. No one on the call followed up.
FY26 guidance revisions: the raise is concentrated entirely on the cash flow side
Source: Synopsys 3Q26 and 2Q26 full-year target tables; compiled by the author
The explanation does have a home on the statements. Days sales outstanding fell to 51 days on the company's basis, the lowest since FY25, and net accounts receivable are down 12.4% from the start of the year.
Three threads nonetheless make this the least well-argued line in the guidance.
BofA models cash flow more finely than the other three, publishing quarterly series for operating cash flow, free cash flow, DSO and inventory days. It modelled $302.1mn of free cash flow for the quarter. The actual figure was \$746.3mn, 147% higher. When the sell-side house closest to the company fails to anticipate a quarter's collections, those collections are not a routine item in anyone's model.
One cell on the same balance sheet is moving the other way. Inventory rose 31.2% from the start of the year to \$479.1mn, and on BofA's basis inventory days rose 42.4%, faster than the 25.4% increase in the inventory balance itself. Management explained EDA's strength partly through a record year for hardware, and that sits in tension with slowing turns: if hardware shipments were at an all-time peak, inventory days should be flat or falling. Pre-building for Q4 delivery and revenue recognition lagging production both explain the data, and the available material cannot separate them.
The third thread went unmentioned from start to finish. The One Big Beautiful Bill Act, signed in July 2025, restored immediate expensing of domestic R&D from FY26, which lowers current cash taxes directly. The company wrote this into the 10-Q and used it to explain the move to an 18% three-year normalized tax rate. The CFO did not mention the tax change at all when explaining the free cash flow raise.
V. The Board Raised the Restructuring Budget by 42.3%, and Not One of Ten Analysts Asked
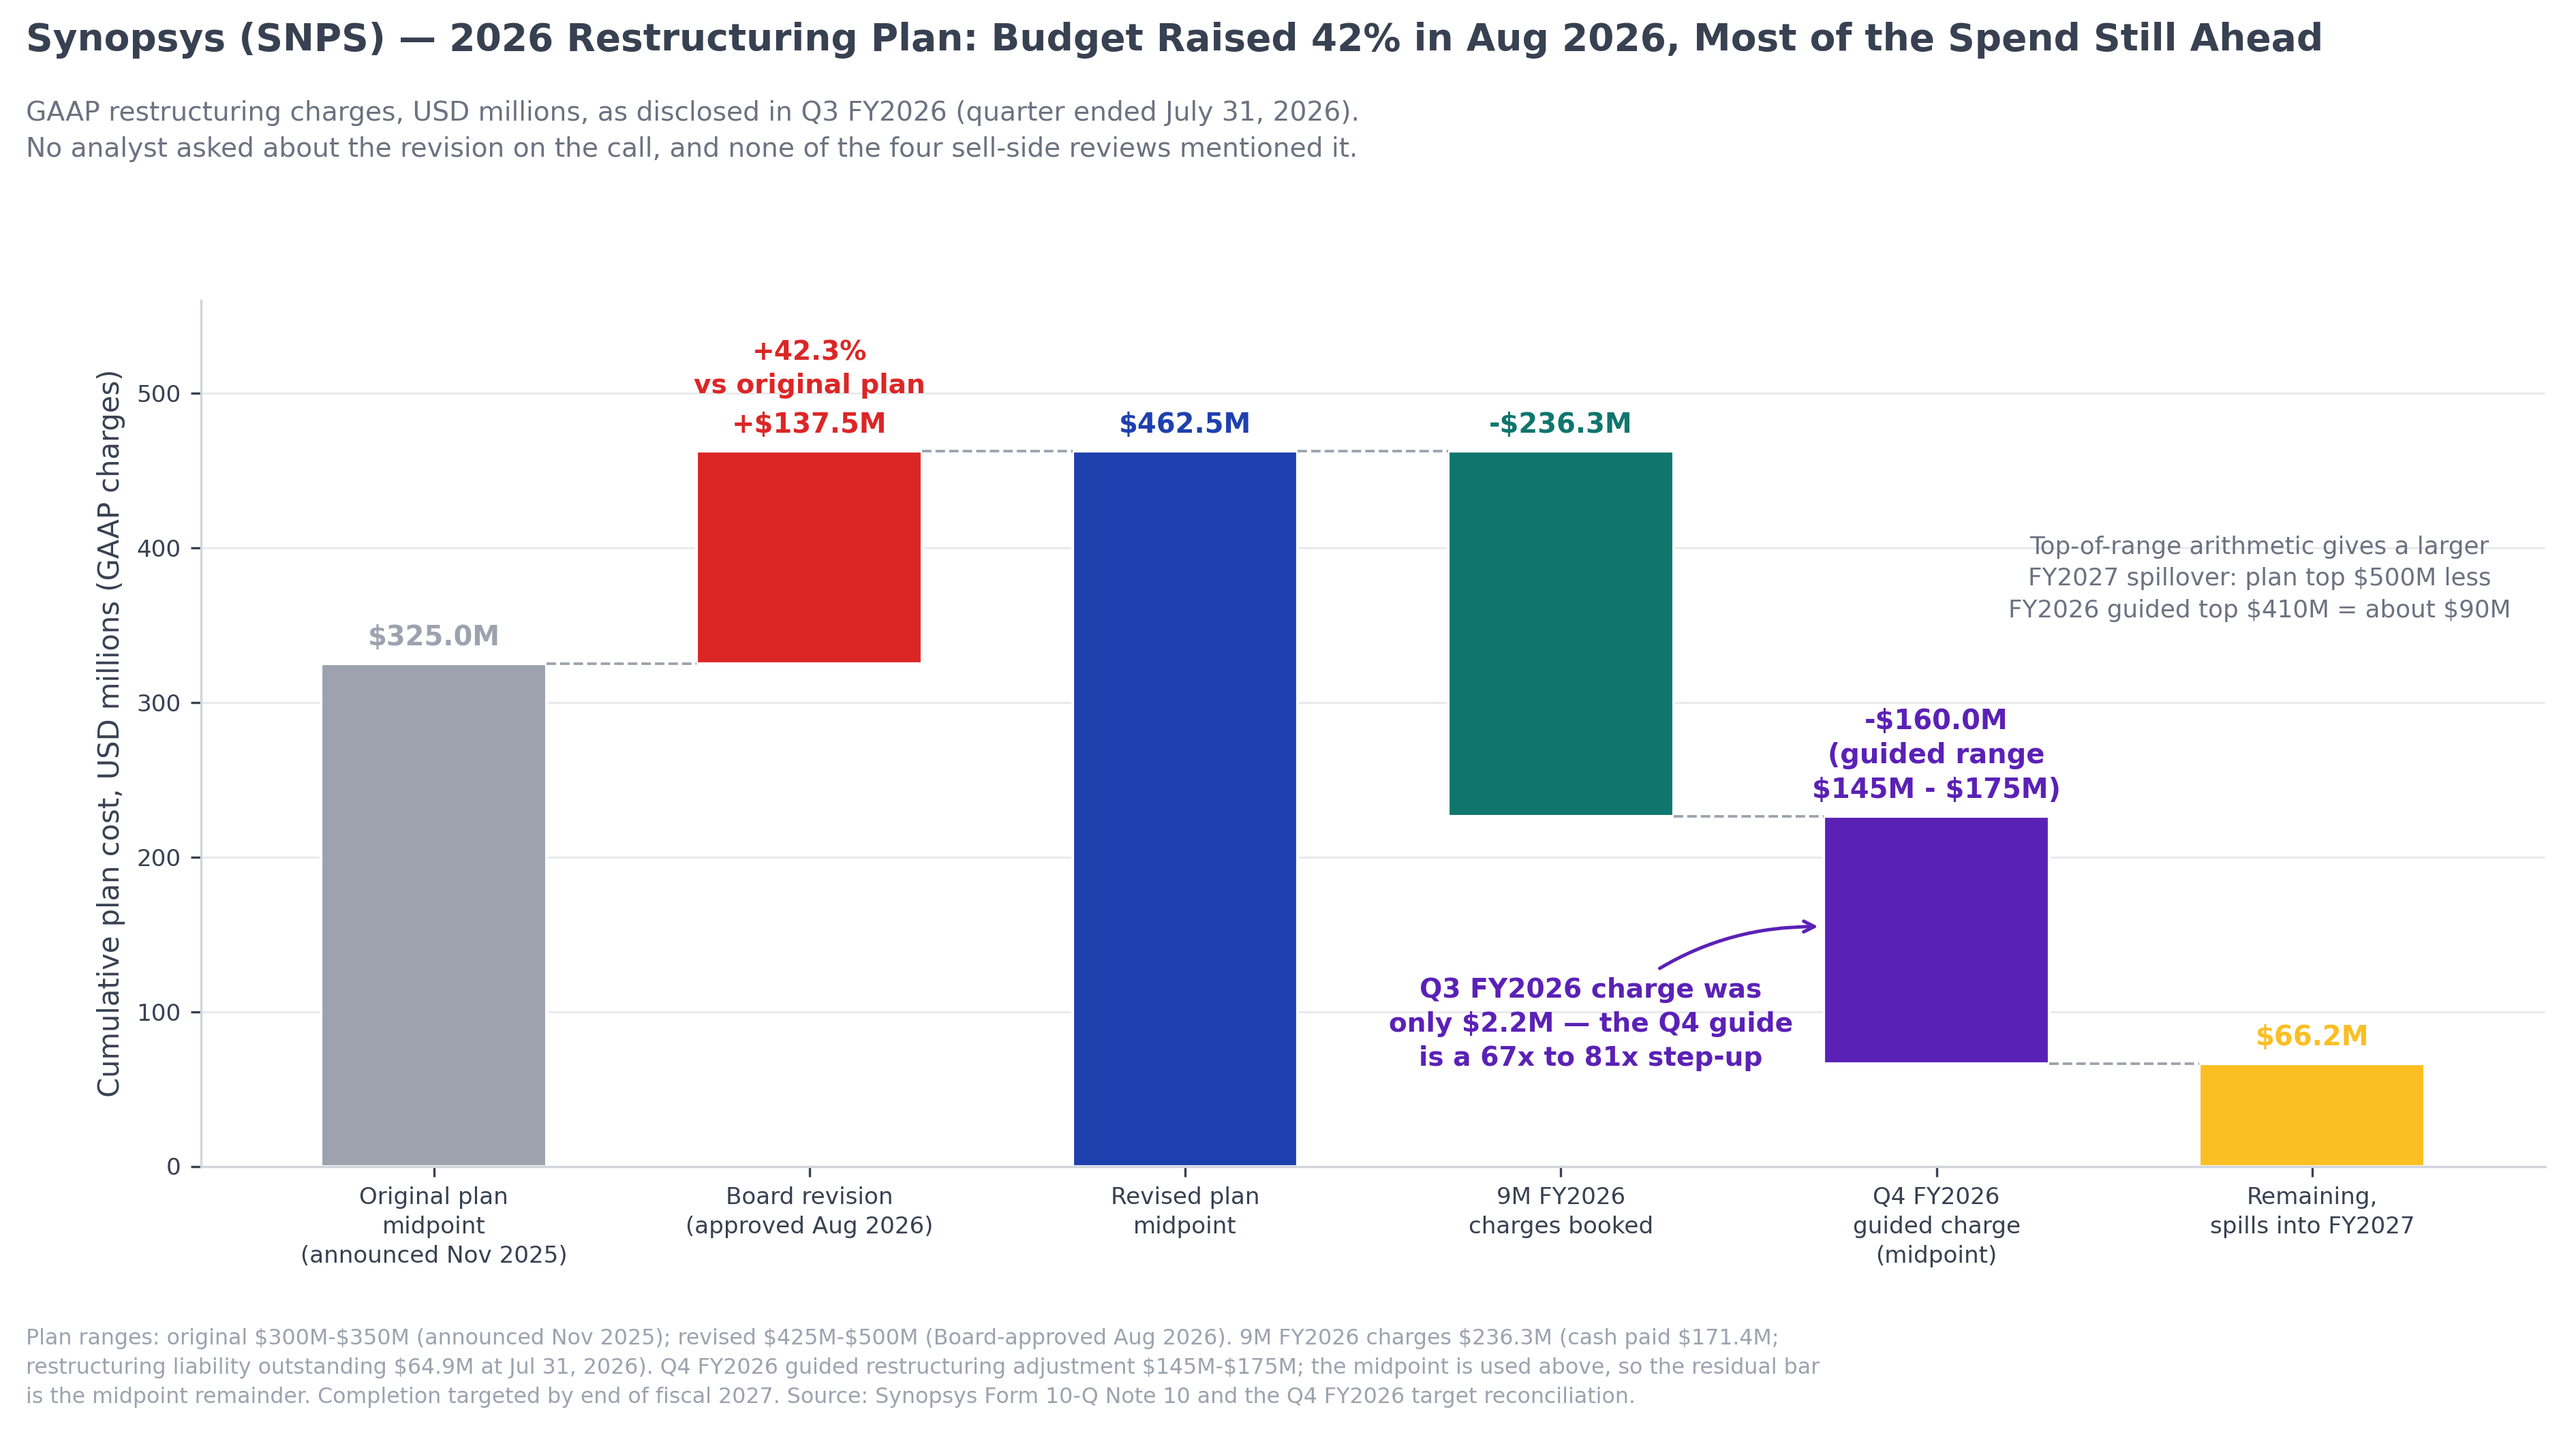
The 2026 restructuring plan, launched in November 2025, originally carried an estimated total cost of \$300mn to \$350mn. In August 2026 the board approved raising that range to \$425mn to \$500mn, lifting the midpoint from \$325mn to \$462.5mn, an increase of \$137.5mn or 42.3%.
The press release headline did not mention it. Across roughly fourteen rounds of questions from ten analysts, no one asked. All four sell-side reviews passed over it in silence.
The 2026 restructuring plan, budget versus progress: Q4 is a 67x to 81x step-up
Source: Synopsys 3Q26 Form 10-Q Note 10 and Q4 FY26 target reconciliation; compiled by the author
The pacing is the striking part. Actual restructuring expense this quarter was $2.2mn. The Q4 guidance range is \$145mn to \$175mn, a sixty-seven to eighty-one fold step-up in a single quarter. On midpoint figures, \$66.2mn of the plan still spills into FY27; at the top of the range, roughly \$90mn.
The only clue offered on the call was half a sentence from the CFO explaining the GAAP expense range: the increase reflects the company accelerating delivery of synergies it has already committed to. That framing casts the revision as deliberate acceleration rather than a cost overrun, consistent in direction with the separate statement that cost synergies are tracking ahead of the commitments made at closing. It comes with no verifiable composition. No incremental headcount reduction, no site count, no estimate of how much FY27 operating expense the acceleration buys back.
Put the two facts side by side. The sell-side collectively debated a \$0.31 increase in non-GAAP EPS guidance and collectively skipped a board approval that raised a cost midpoint by \$137.5mn. It is the widest gap between importance and attention anywhere in this quarter's material, and it argues against Goldman Sachs's model, which builds 380 basis points of FY27 operating margin expansion.
VI. The Argument the Call Was Actually Having
One strategic proposition drew fire from three analysts on three different angles, the only question of the night that was attacked repeatedly: could AI produce an end-to-end path that routes around commercial EDA entirely?
Charles Shi of Needham laid out the fullest version of the scenario. Use commercial EDA tools to generate synthetic data, train an AI model on it, and have that model complete the design end to end. Jason Celino of KeyBanc pushed the question closer to the present, noting that OpenAI had talked the previous day about using its own AI models to accelerate the design of its in-house chip.
Goldman Sachs supplied the positioning context in its report: investors had been relatively bearish on the stock, and the core worry was precisely that AI might damage software. That sentence reframes the three assaults on the call from analyst curiosity into a live stress test of the bear case.
Sassine Ghazi's rebuttal rests on two supports. The first is accuracy and determinism, the two properties he argues matter most in an autonomous workflow, and accuracy has to return to ground truth physics. As he put it, customers will not put hundreds of millions of dollars into a product without confidence it will work. The second support turns the threat argument inside out: "these models are not static, they are constantly changing and they need to keep learning. So the opportunity is the opposite. It is not a threat, it is a massive demand for our software, for training, for inference, for continuously handling complexity." His closing formulation on monetization was that whichever route the customer takes, the requirement is more licenses.
Readers who have followed this series will find that familiar.
Four months ago, on the Cadence 1Q26 call, the same Charles Shi put a structurally identical question to Anirudh Devgan. Devgan's answer gave Agents Don't Replace the Base Tools, They Call Them Harder its title: on a chip with 100 blocks and 100 engineers, each engineer running one block typically runs one or two experiments; when an agent runs those blocks, it may run 10 or 100 variations.
Two CEOs, four months apart, same analyst, same question, structurally identical answers.
Which raises the obvious question: if the logic holds, which statement should it show up on first?
I gave an answer in the Cadence piece, and a reason. Not the P&L, where the Hexagon purchase accounting had swallowed most of the story. The cleanest location is backlog, because the base tool capacity written into a historical contract stops being sufficient once agents change how the work is done, and customers come back to add on outside the renewal cycle. Cadence's backlog that quarter was a record \$8.0bn, of which Hexagon contributed only about \$75mn, and it broke the usual Q1 seasonal decline.
Synopsys's backlog stands at \$10.9bn, up 7.9% year-over-year and down 1.8% sequentially. On the time series BofA supplied, that is a third consecutive sequential decline. Management attributed the drop entirely to the Processor IP divestiture.
That attribution deserves a fair hearing. The divested business affects revenue for the remainder of FY26 by about \$40mn, annualising to roughly \$96mn; on a two to three year remaining contract term, the backlog leaving the books would be roughly \$192mn to \$288mn, comfortably enough to cover the \$0.2bn sequential decline as the company reports it. So the explanation has not been disproven. But Synopsys has never disclosed the absolute backlog that left with Processor IP, the divestiture occurred only in this quarter, and it cannot account for the two declines before it. The two companies' backlog definitions are also not strictly comparable.
What can be stated is narrower. Measured by the yardstick I set out in the Cadence piece, Synopsys has not yet produced the same class of evidence. There are more than thirty active agentic customer engagements. The autonomous verification agent demonstrated with NVIDIA at DAC delivered up to 50x faster time to RTL verification closure with an additional 20% coverage improvement, and the autonomous EDA workflows running on Microsoft Discovery cut debug cycle time by as much as 40%. That is all evidence on the technology side. On the revenue side, the quarter disclosed no agentic revenue and the call offered no modellable monetization parameter of any kind. When Charles Shi pressed for the specific contribution to revenue growth, the answer was that more would be said on September 30.
VII. Why the Multiple Came Down
Which brings us back to that opposite move.
Goldman Sachs took its multiple from 40x to 35x while lifting its normalized EPS base from \$15.00 to \$17.00. The two almost exactly offset, and the target price did not move from \$600. J.P. Morgan held at \$600, applying roughly 33x to CY27 EPS of \$18.30. At BofA the multiple cut ran well ahead of the earnings raise, and the target fell from \$600 to \$500. Morgan Stanley published neither a rating nor a target in this round, giving only the method: an industry range of 30x to 35x.
The absolute spread between targets comes almost entirely from the multiple assumption. BofA's 24x is the only one outside the 30x to 35x industry range all three cite, and its stated reason is a relative figure: the NTM P/E discount of Synopsys to Cadence has widened to roughly 13x against a historical range of 5x to 7x, and that discount will not narrow until four uncertainties are resolved. Those four are the Ansys products and synergies, Intel's long-term market share, the durability of the IP business, and the monetization of agentic AI. Three of the four have been explicitly deferred to the investor day. The fourth went entirely unmentioned on the call.
The other side of this needs stating. Goldman Sachs wrote plainly that it cut its multiple because peer multiples had come down, which is a sector-wide repricing rather than a company-specific change of view. If that is what is happening, the multiple compression reflects EDA as a group, not the argument over Synopsys. The one piece of evidence that separates the two is BofA's widening discount to Cadence, because it is a relative measure and a sector-wide de-rating would leave it unchanged.
BofA also supplied the most binding piece of arithmetic in the four reports. Even assuming EDA, IP and Ansys compound at 15%, 20% and 12% respectively from FY26 to FY28, and non-GAAP gross margin improves by another point, FY28 EPS reaches only \$23.43, just 14.5% above its base case of \$20.47. The inference it draws is that most of the upside has to come from multiple recovery rather than from earnings surprise.
The structure of the earnings dispersion supports the same reading. The full range of FY27 revenue estimates spans 2.0%; the full range of FY27 EPS estimates spans 9.0%, four and a half times wider. The entire source of that dispersion can be located precisely in the operating margin path. Goldman Sachs models FY27 at 45.2%. Morgan Stanley models 42.6%. The 260 basis point gap is the whole argument. The company's own long-term operating margin objective is mid-40s, which means Goldman Sachs is assuming it completes in two years the climb management has defined as long-term.
VIII. September 30 Delivers the Model. The Number That Tests It Is Ten Weeks Behind
Get the sequence straight first. The investor day falls on September 30, and what it delivers is a narrative and a new long-term financial model. No new operating data arrives that day. FY26 ends on October 31, and Q4 results are reported in early December by company convention; last year's 4Q25 print landed on December 10. The first hard number capable of testing that new model is roughly ten weeks behind the investor day.
Management's list of items explicitly deferred to September 30 is unusually tidy: how agents and new workflows will be modelled into long-term growth, the modellable economics of IP Factory Two once it shifts from license plus NRE to license plus royalty, the FY2027 contribution from Multiphysics Fusion, and whether the long-term IP growth guidance gets updated. Two items were refused outright: the size of the security IP opportunity, and the quarterly dollar amount of the Ansys accounting change.
That second refusal matters more than it looks. The Ansys product group grew 9.0% sequentially this quarter, directly contradicting the seasonality framework management laid out last quarter, under which the second half was supposed to decelerate quarter by quarter. On the figures disclosed previously, the accounting change contributed \$4.5mn last quarter and \$60mn for the full year. Spreading the remaining \$55.5mn evenly across Q3 and Q4 gives roughly \$27.8mn a quarter, equivalent to 47% of the \$58.7mn sequential increase in Ansys revenue. Analysts pressed three times in a row and management never confirmed the in-quarter figure. None of the four sell-side reviews mentioned the factor at all. The sell-side's acceptance of Ansys strength was made without that denominator.
In the final round of Q&A, Kelsey Chia of Citi argued directly that the long-term IP growth rate now merits an upgrade, citing accelerating chip design activity, hyperscaler custom silicon investment and stabilisation in the non-AI segment. Sassine Ghazi accepted every premise and held mid-teens unchanged. Accepting the premises while leaving the conclusion untouched tells you the timing of any upgrade is being actively managed, not constrained by a shortage of evidence.
The December print then does two things at once.
It is the first clean year-over-year comparison after the consolidation arithmetic washes out. Ansys closed on July 17, 2025, so 4Q25 already contained a full quarter of it, making 4Q26 the first period where base and current quarter both include Ansys. From that report onward, the year-over-year growth rate reflects this company's organic capability for the first time. The reason Ansys product group growth is not meaningful on a year-over-year basis this quarter is precisely that the base holds only about two weeks of it.
It also settles the widest disagreement in the sell-side forecasts by the most mechanical means available. BofA forecasts Q4 Design IP of \$493.7mn, up 4.2% sequentially. Goldman Sachs's full-year estimate implies \$448.0mn, down 5.4%. The 10.2% gap between them is the largest anywhere in the estimates, and it sits on exactly the line where management kept repeating that IP would continue to grow sequentially while declining to quantify by how much. That gap will not be closed by argument. It will be closed by a number.
The same report updates one indicator no sell-side house has cited. Sales-based royalty revenue was \$28.1mn this quarter, down 36.9% year-over-year, with nine-month cumulative royalties of \$89.8mn, down 5.7%. Royalties falling while Design IP revenue recovers tells you the IP revenue mix is still migrating from back-end royalties toward front-end licensing and NRE. Factory Two exists to bend that curve the other way. Whether it works will show up on this line before it shows up anywhere else.
Closing Thoughts
Read the three quarters together and this company has been filling in its answer sheet one box at a time. 1Q26 filled in margins. 2Q26 filled in the Design IP inflection. 3Q26 filled in half of growth: three consecutive quarters of widening sequential EDA momentum, and Design IP back to year-over-year growth. Execution is not in dispute. Synopsys has proved it four quarters running.
The change is on the other side. Value capture has been waiting for its number for three quarters, and this quarter the wait acquired a visible price: among the three houses publishing targets, the largest cut was 16.7%, and the reason was not earnings. It was time. BofA's 13x relative discount is, in substance, the market quoting a price for the question of how much longer.
After September 30 the judgment gets easier. Either the long-term financial model is replaced, or it is reaffirmed unchanged. The first gives the multiple a reason to be marked back up. The second makes that 13x discount look progressively less like a bias.
And between now and December, no new operating data arrives at all. Through that gap, the only line still speaking on everyone's behalf is royalty revenue, down 36.9% year-over-year. It holds no meetings and issues no guidance. The next time it appears on the statements, it either keeps falling, or it turns.
Earnings Call Recap
I will now share a more detailed analysis on this earnings result behind the pay wall:


