
The Yardstick Behind the 400× Engineer
If a single founder can finish in five days what six engineers once took eighteen months to build, what are we actually counting when we celebrate the speedup—real value created, or "Cadillac tasks" that AI made just cheap enough to bother doing in the first place?


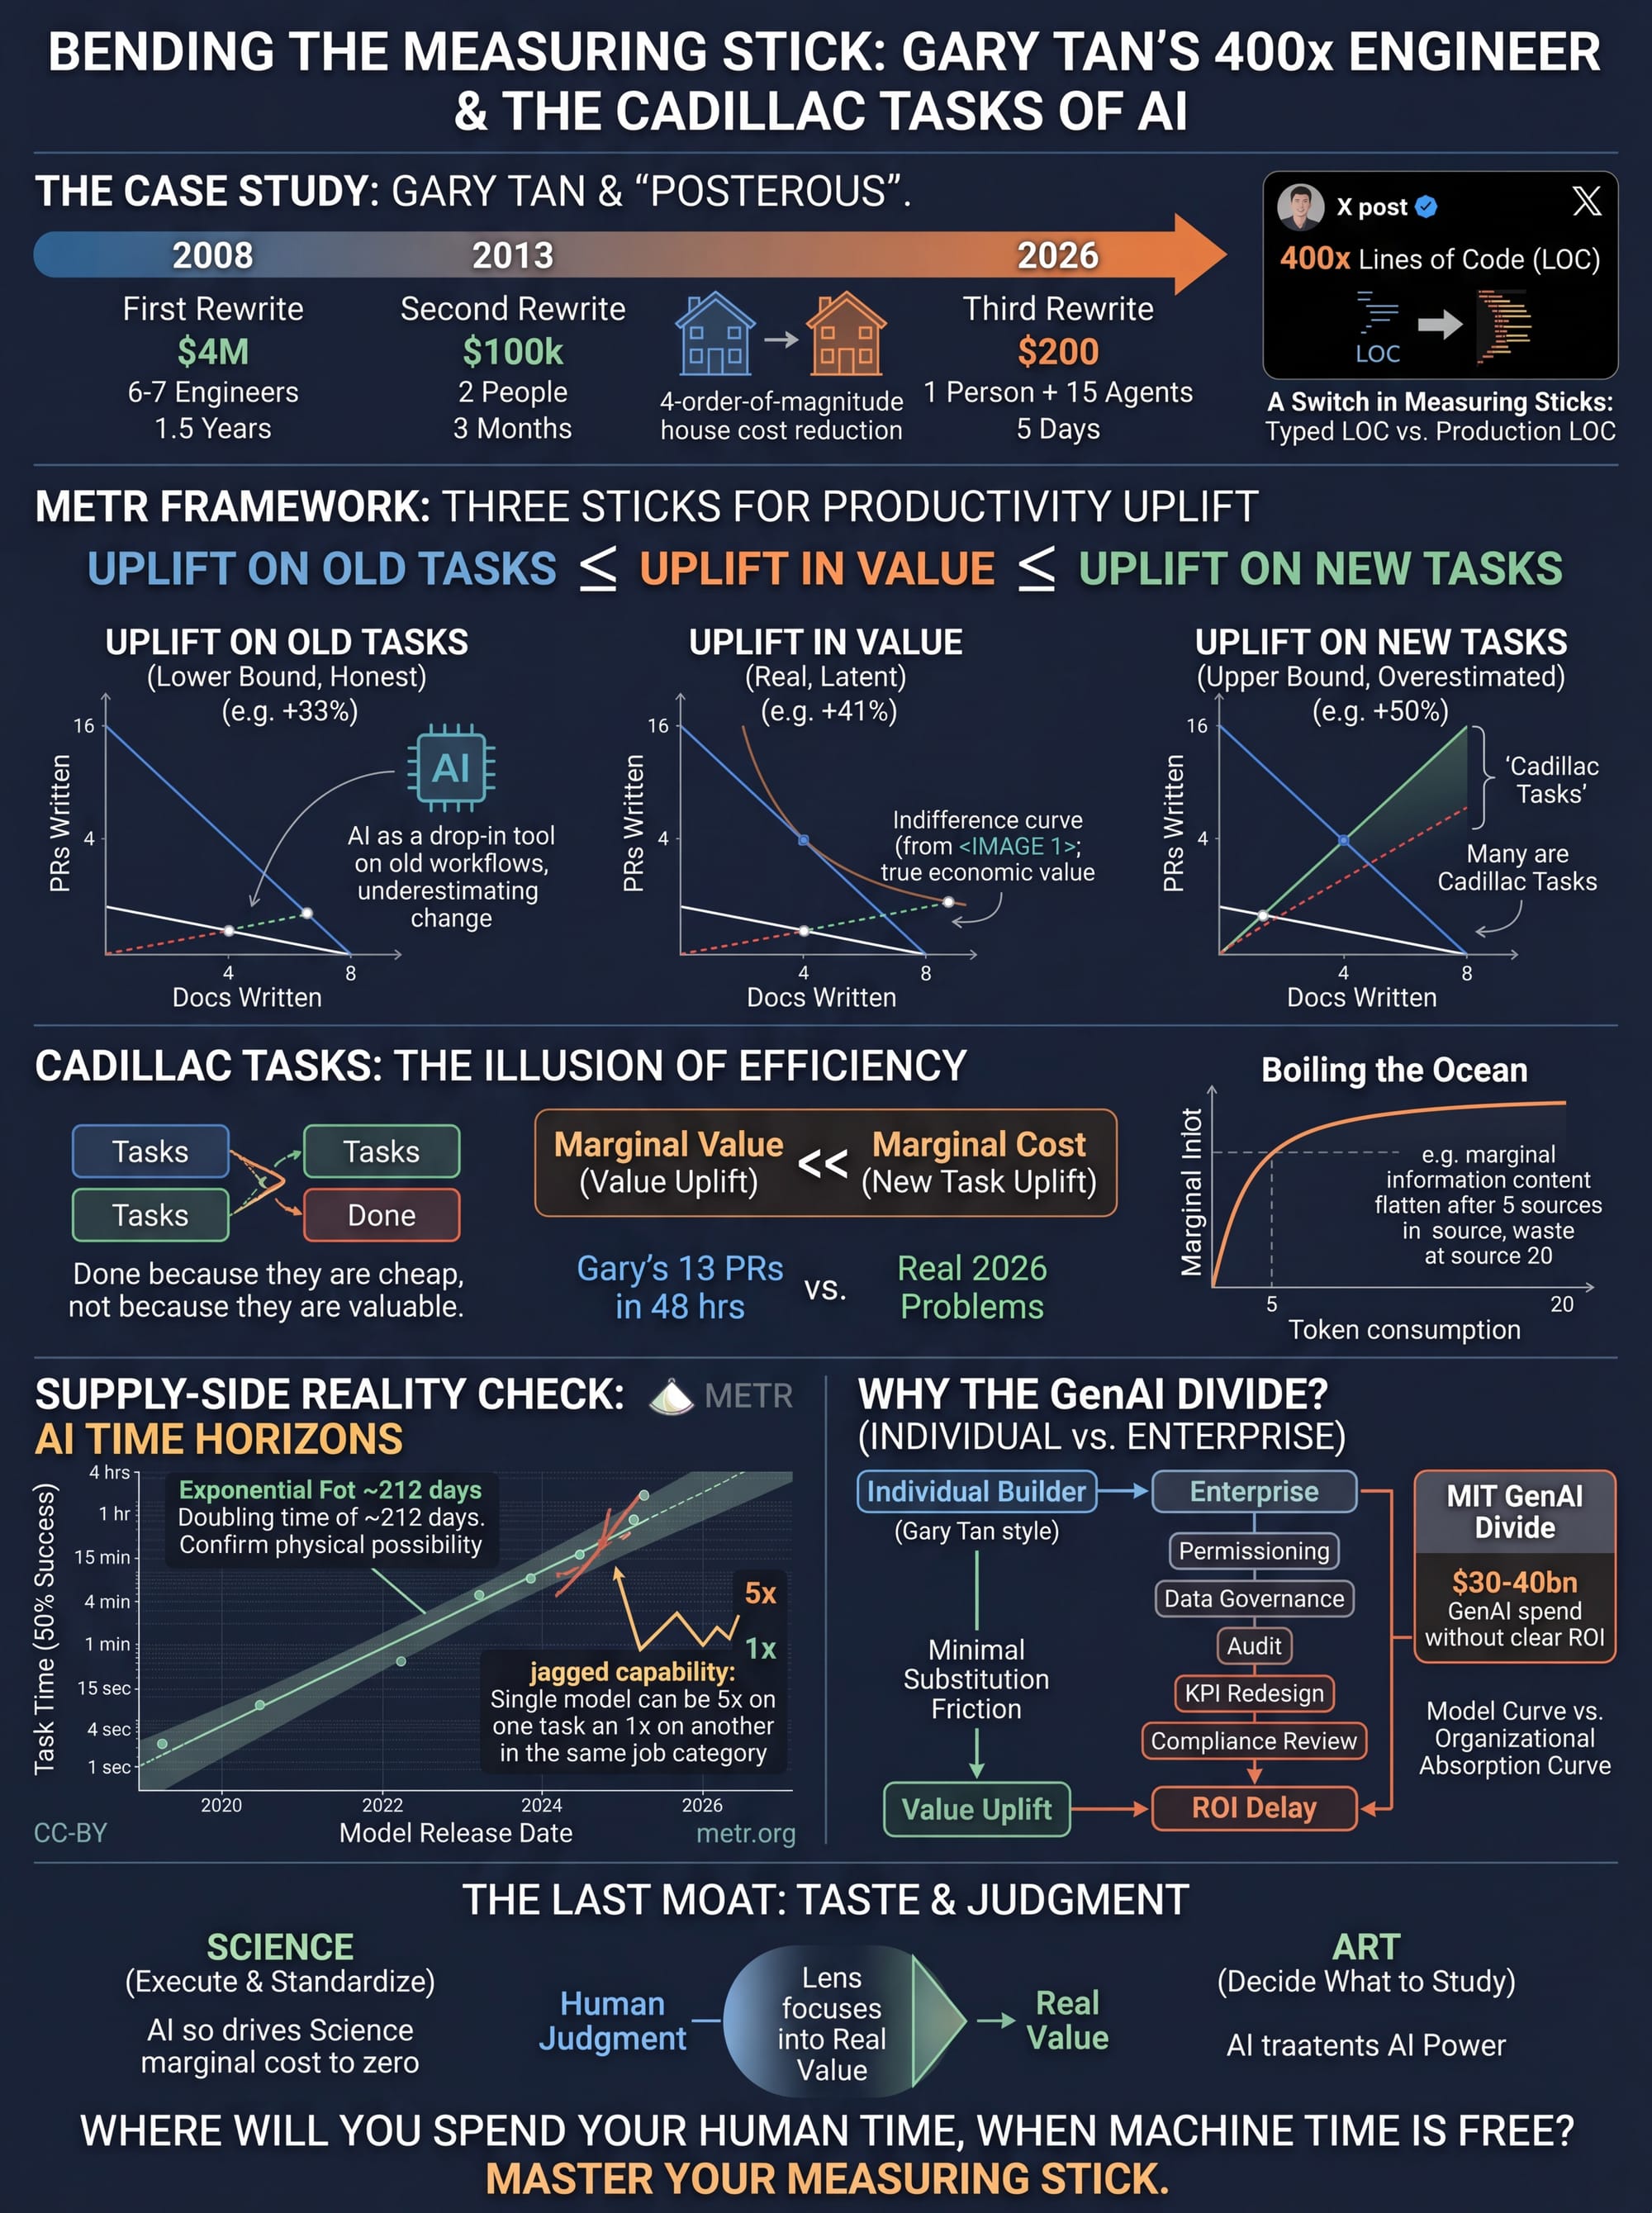
Before the Yardstick Bends — The 400× Engineer, Time Horizons, and Cadillac Tasks
Gary Tan reopened Claude Code one late night in early 2026.
He hadn't written serious code in 13 years. But over the next few weeks, with a single Claude Code Max account, roughly \$200 in token spend, and 5 days of work, he rewrote Posterous — his first YC company from 2008 — for the third time in his life. The three rewrites, as he laid them out on camera at The Light Cone, look like this: the first cost about \$4 million, 6–7 engineers, and 1.5 years; the second about \$100k, 2 people, and 3 months; the third about \$200, 1 person (plus 15 agents running in parallel), and 5 days.
Across sixteen years, the total cost of "building the same house" dropped by roughly four orders of magnitude.
Then he posted on X that, after normalizing his public Git repos down to logical lines of code, his 2026 output was 400× his 2013 output. The internet exploded. "Lines of code is obviously not productivity." "Then you explain the number."
I watched the argument for a while. As someone who prefers raw data, I believe Gary is being honest — he really is living inside that feeling. But as an analyst, I have to push one layer further: 400× of what? 400× the work output? 400× the value? Or does it just mean he can finally afford to do things he would never have greenlit in 2013?
I've written before that AI adoption is no longer the most interesting question. In OpenAI & Anthropic Adoption I covered the user-scale and frequency story; in MIT GenAI Divide I covered a counter-intuitive fact — enterprises have collectively spent \$30bn–\$40bn on GenAI, yet most still cannot point to clean ROI. The two are not in tension. They're two reminders, from opposite directions, that adoption is not productivity, and tool usage is not value creation.
Gary Tan's 400× story and the enterprise-\$30bn-with-no-ROI story are two faces of the same coin. In an era where AI is bending the productivity curve toward the vertical and where 400×-type numbers are becoming standard LinkedIn openers, the most valuable object isn't a new tool. It's a yardstick that hasn't been bent.
METR's two recent papers — one on the task-completion time horizons of frontier AI models, the other on the three measures of productivity uplift — happen to provide exactly that yardstick. In what follows, I'll put Gary's story, METR's two frameworks, and a quiet stress-test of Anthropic's own research all on the same table.
I. That 400× Was Already Self-Revised Upward
One detail most commentators glossed over: Gary originally said his coding velocity was 100× his 2013 self.
He revised himself later. "After stripping it down to logical lines of code, it actually went up," he said. "Turns out it's 400×."
Pay attention to the direction of that revision. An independent observer redoing the math might revise down; the protagonist redoing the math revised up — by three-fold. This isn't deliberate inflation. He switched yardsticks. From "how many lines per day do I punch out" to "a professional engineer ships maybe 30–50 tested, production-ready lines a day; my part-time pre-AI baseline was 14; and I'm now orchestrating 15 agents in parallel." Two completely different gauges, both labeled "lines of code."
This is precisely the problem METR's Task Substitution and Uplift paper, published on May 8, 2026, devotes pages to: when the task mix changes, every yardstick anchored in the old mix starts to fail.
Tom Cunningham and Parker Whitfill split "AI productivity uplift" into three measures. First: uplift on old tasks — if you plug today's AI into the 2021 pre-AI workflow, how much time do you save? Second: uplift on new tasks — for what you actually do today, how long would it take using only pre-AI methods? Third: uplift in value — once you're allowed to recompose your work, by how much does your output's economic value actually rise?
The line in their paper worth copying onto a whiteboard is this inequality:
Translate this back to Gary's situation. His 400× — which yardstick is it on?
If his baseline is "the 2013 me was writing code; the 2026 me is also writing code, just faster," he's reading the old-task yardstick. That yardstick underestimates, because it assumes you don't reallocate time. But Gary clearly reallocated: he isn't finishing the 2013 Posterous codebase faster — he's running a workflow that didn't exist in 2013, an ADHD CEO dispatching 15 agents in the gaps between meetings.
If his baseline is "I produced X today; how long would the 2013 me need to produce X?", he's reading the new-task yardstick. That one overestimates, because some of what's in the numerator would never have been greenlit in 2013 at all.
The yardstick that actually matters — the value yardstick — sits between the other two and can't be observed directly. It's not in the Git commit log.
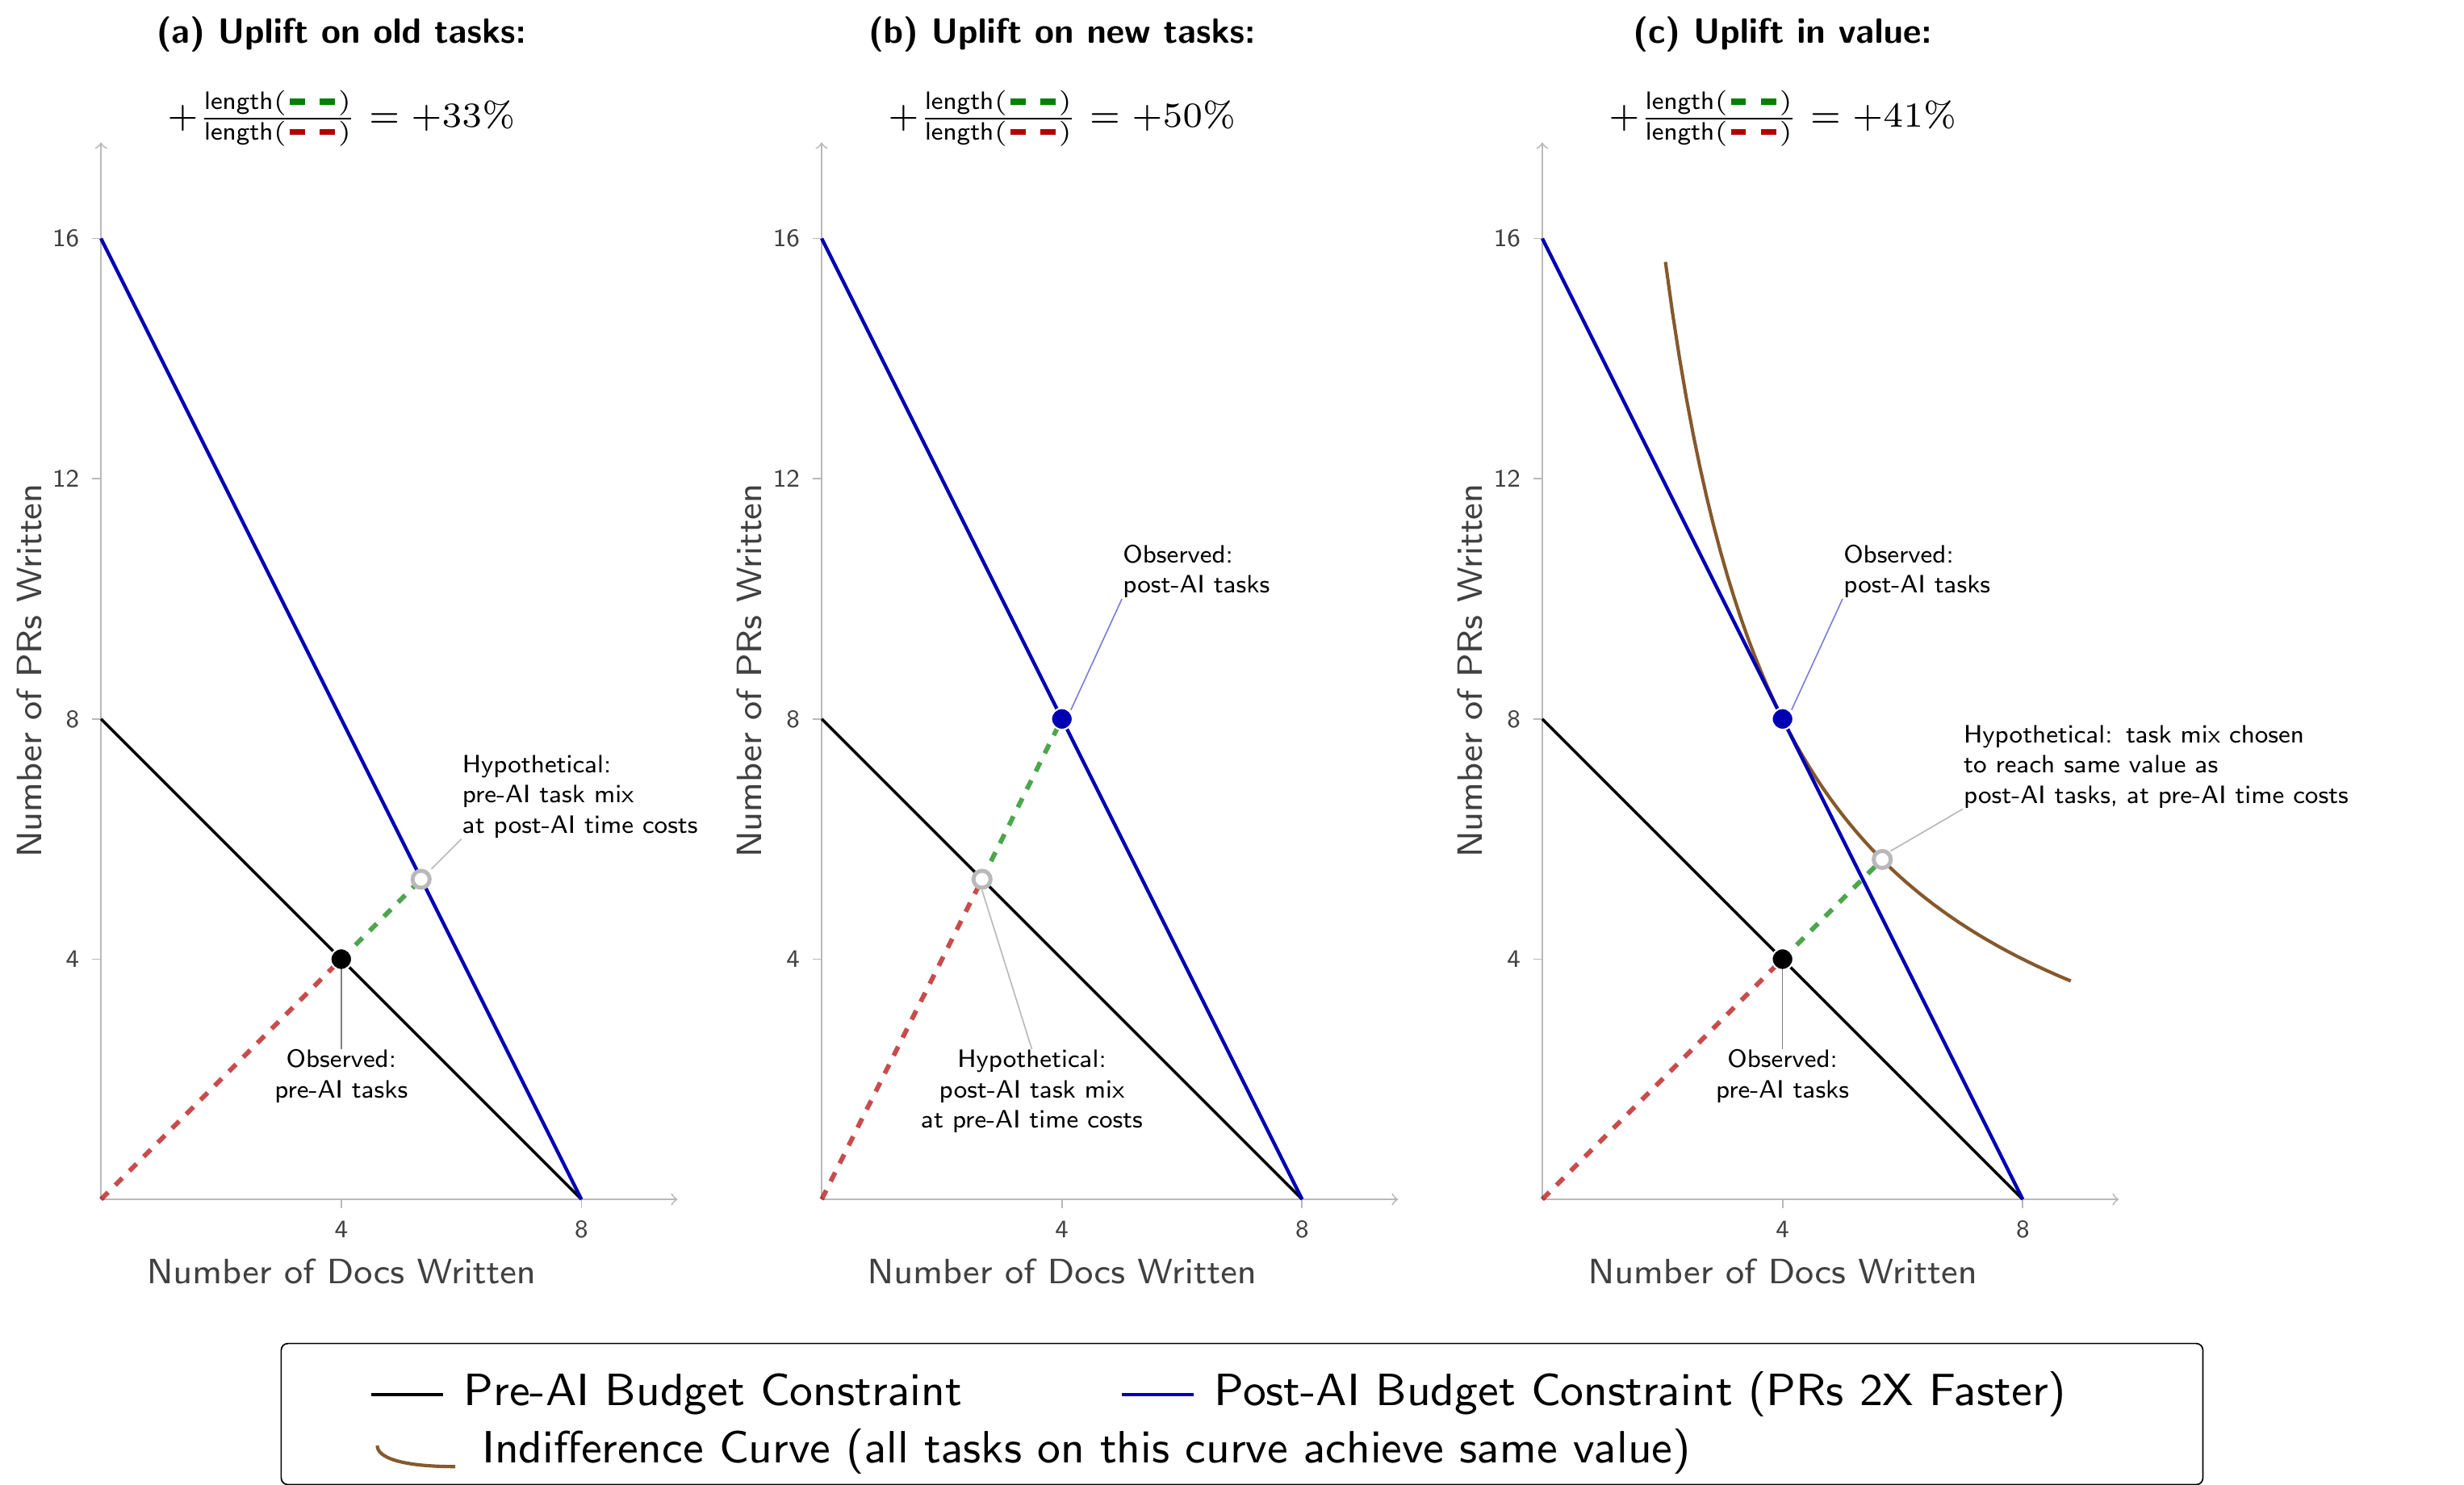
METR visualizes this with a software-engineer example. An engineer works 8 hours a day on two tasks: writing documents and writing pull requests. Pre-AI, both take 1 hour. AI makes PRs 2× faster but doesn't help with docs. The engineer reallocates: still 4 docs, but PRs jump from 4 to 8.
Three measures of uplift in the simple example (red = baseline time cost; green = incremental time cost)
source: METR, Task Substitution and Uplift (https://metr.substack.com/p/2026-05-08-task-substitution-and-uplift)
In this very gentle example, the old-task yardstick reads +33%, the new-task yardstick reads +50%, and the true value uplift sits around +41%. Remember — the PR speedup is only 2×.
II. 13 PRs and the Anatomy of a Cadillac Task
Gary handed us a perfect data point — one that plugs straight into the METR framework.
He said over the past 48 hours he had queued up 13 PRs waiting for manual testing. Every time a new idea hit him, he opened Claude Code, ran the CEO Plan Skill in plan mode to design, approved, executed — and 13 features lined up just like that. The workflow is smooth enough that he himself started complaining that "15 different features waiting for me to manually test" had become the new bottleneck.
Drop this picture into METR's 2D coordinate system — Y axis PRs, X axis docs. Gary isn't writing the pre-AI 4 PRs faster. He's running the extreme point on the new-task budget line, pushing nearly all his budget into PRs and crushing docs to a sliver.
The old-task yardstick is essentially meaningless for him — it only allows 4 PRs, and would read out a temperate, almost disappointing number leading most people to conclude "AI isn't that magical after all."
The new-task yardstick will almost certainly blow out — 13 PRs in 48 hours; for the 2013 Gary to crank out those features by hand would take months. The "uplift multiple" reads enormous.
And the value yardstick? It forces a more uncomfortable question — of those 13 PRs, how many actually solve a problem that 2026 requires solving?
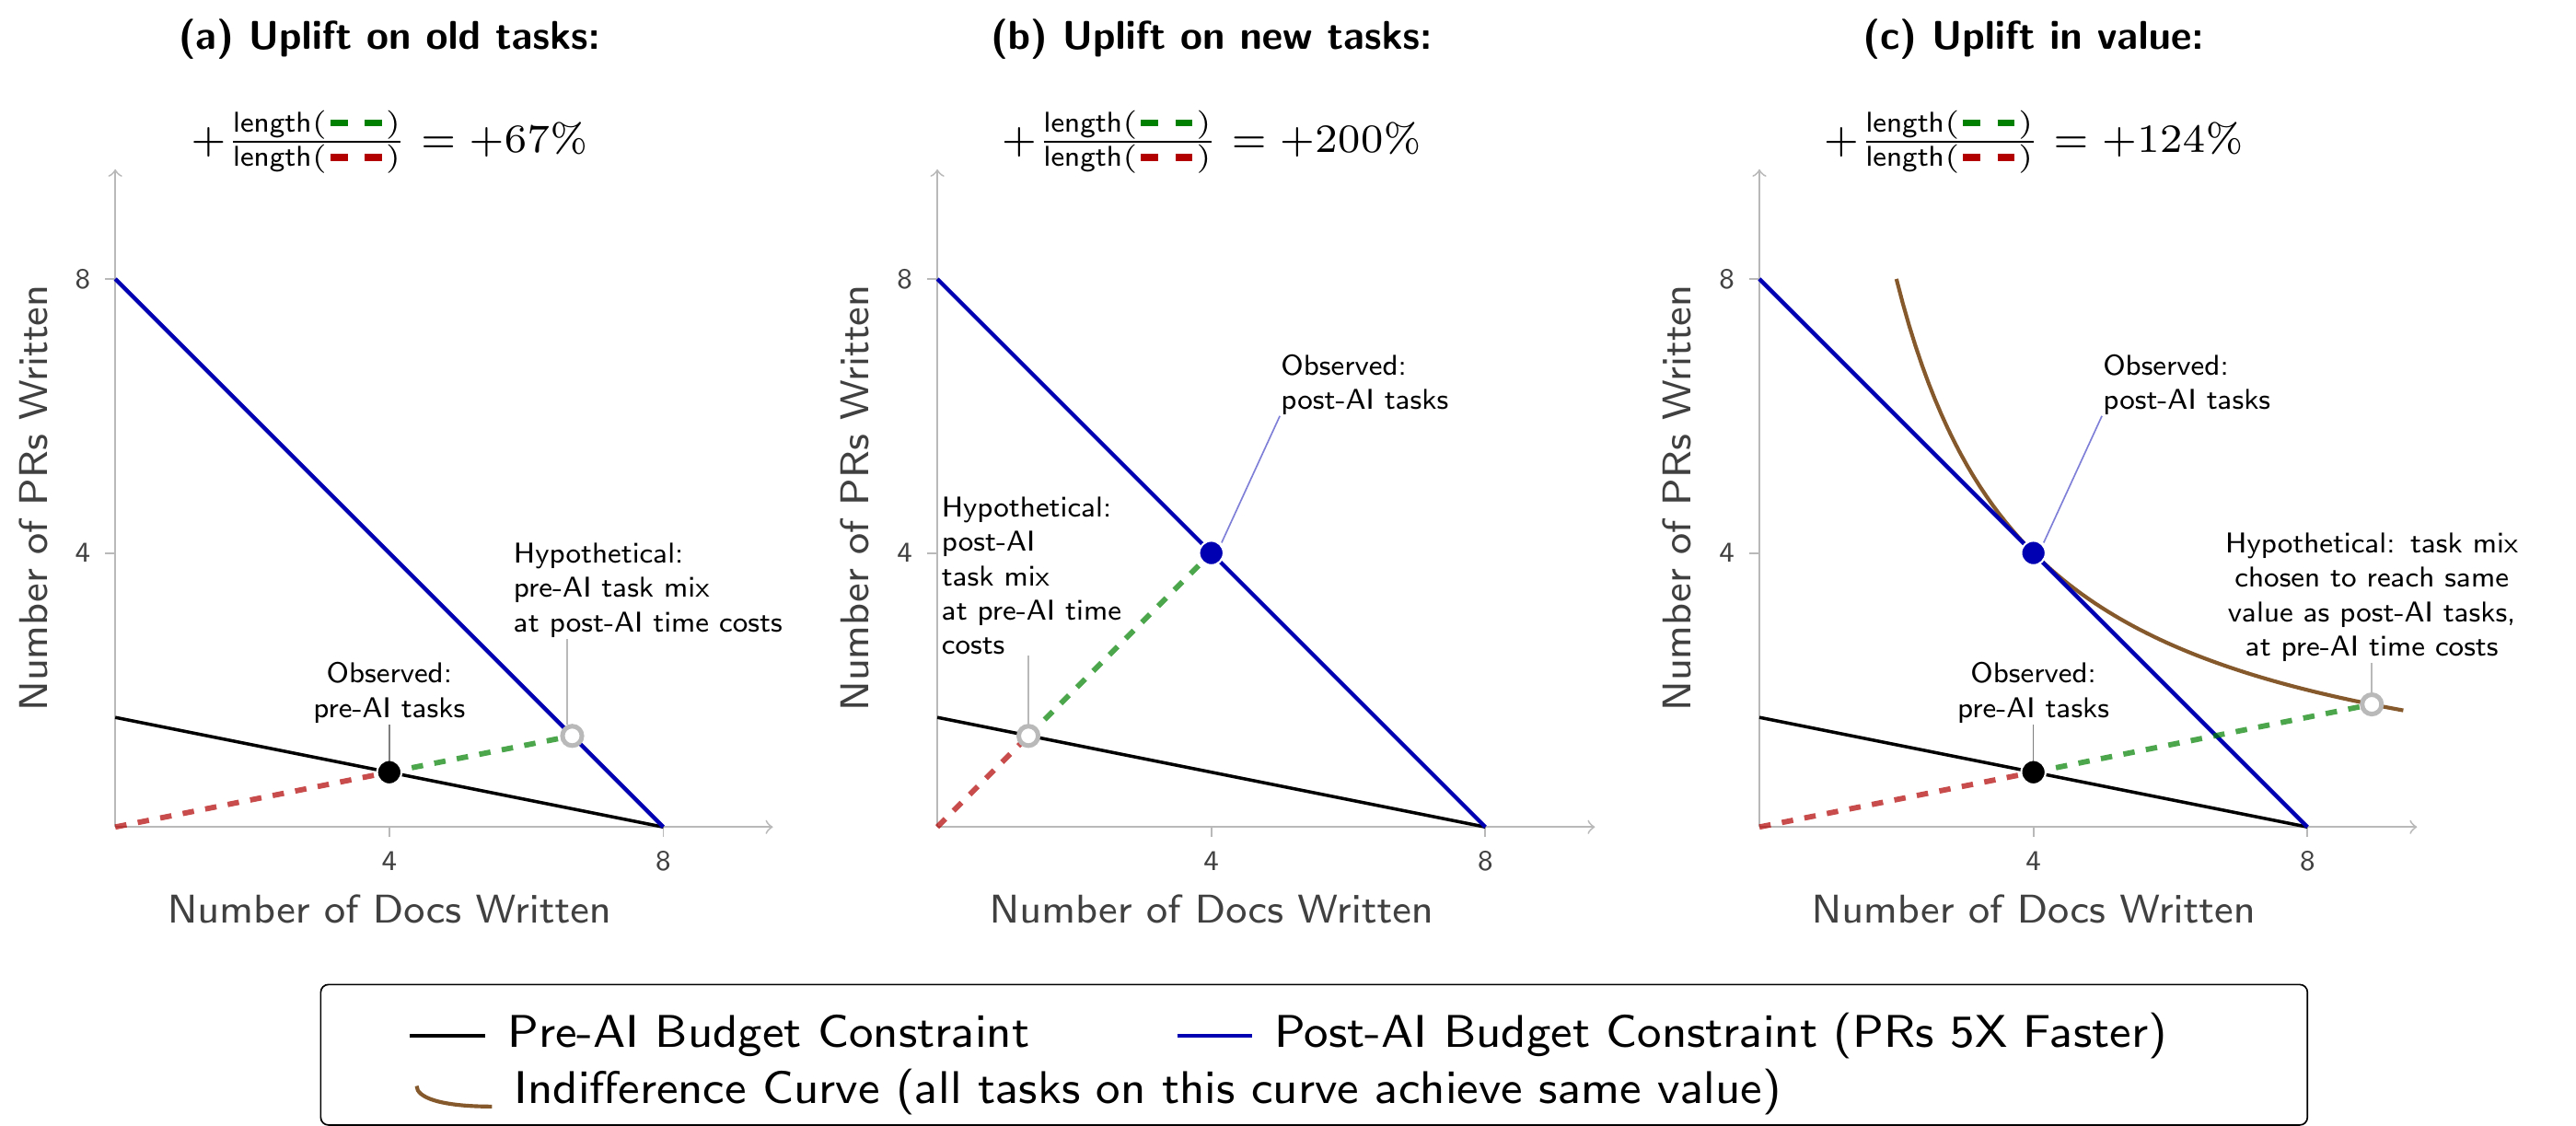
In a more extreme worked example, Cunningham and Whitfill push the PR speedup from 2× to 5×. The three yardsticks immediately diverge:
When a task is sped up 5×, the three uplift numbers diverge dramatically
source: METR, Task Substitution and Uplift (same as above)
Old-task yardstick reads +67%. Value yardstick reads +124%. New-task yardstick reads +200%. A canyon opens between the new-task and value yardsticks.
Inside that canyon live Cadillac Tasks.
What makes the name precise: a \$100,000 Cadillac suddenly sells for ten cents on the dollar. You buy it, and yes, you "got a deal" — but you didn't create \$100,000 of value. You consumed something whose consumer surplus to you, pre-discount, was negative. A Cadillac Task is one you do solely because AI made it cheap, not because the task itself is worth doing.
Look back at Gary's most famous slogan — "boil the ocean."
He explained it like this: "If the marginal work makes something more complete, more remarkable… we don't settle for one source when we can get 20 sources, cross-reference them, and discover that '13 sources say this, 7 sources disagree.'"
I have high respect for what he's doing. The investigative pieces on garrys.org — using Perplexity / X / Grok APIs to run ocean-boiling cross-referencing on the back end — genuinely represent a new and serious mode of journalism. But as an analyst I have to ask: pushing cross-references from 1 source to 20 — does the value scale linearly?
It doesn't. The second source establishes independent corroboration. The third and fourth filter out sampling bias. After the fifth, marginal informational content starts decaying sharply. By the twentieth source you're consuming compute, not signal.
But Claude won't tell you to stop boiling the ocean. Tokens are cheap, so boiling looks like it always wins — AI has pushed the marginal cost of "making it more complete" to nearly zero, and so doing more always looks like the right call. What Cunningham and Whitfill remind you, mathematically, is that the marginal value of "more complete" and its marginal cost are two different things. When cost goes to zero and value decays, the gap falls straight into the canyon between the new-task and value yardsticks.
III. Time Horizons, and a Quiet Stress-Test of Anthropic's Own Numbers
There's still a supply-side question lurking: is Gary's story physically possible?
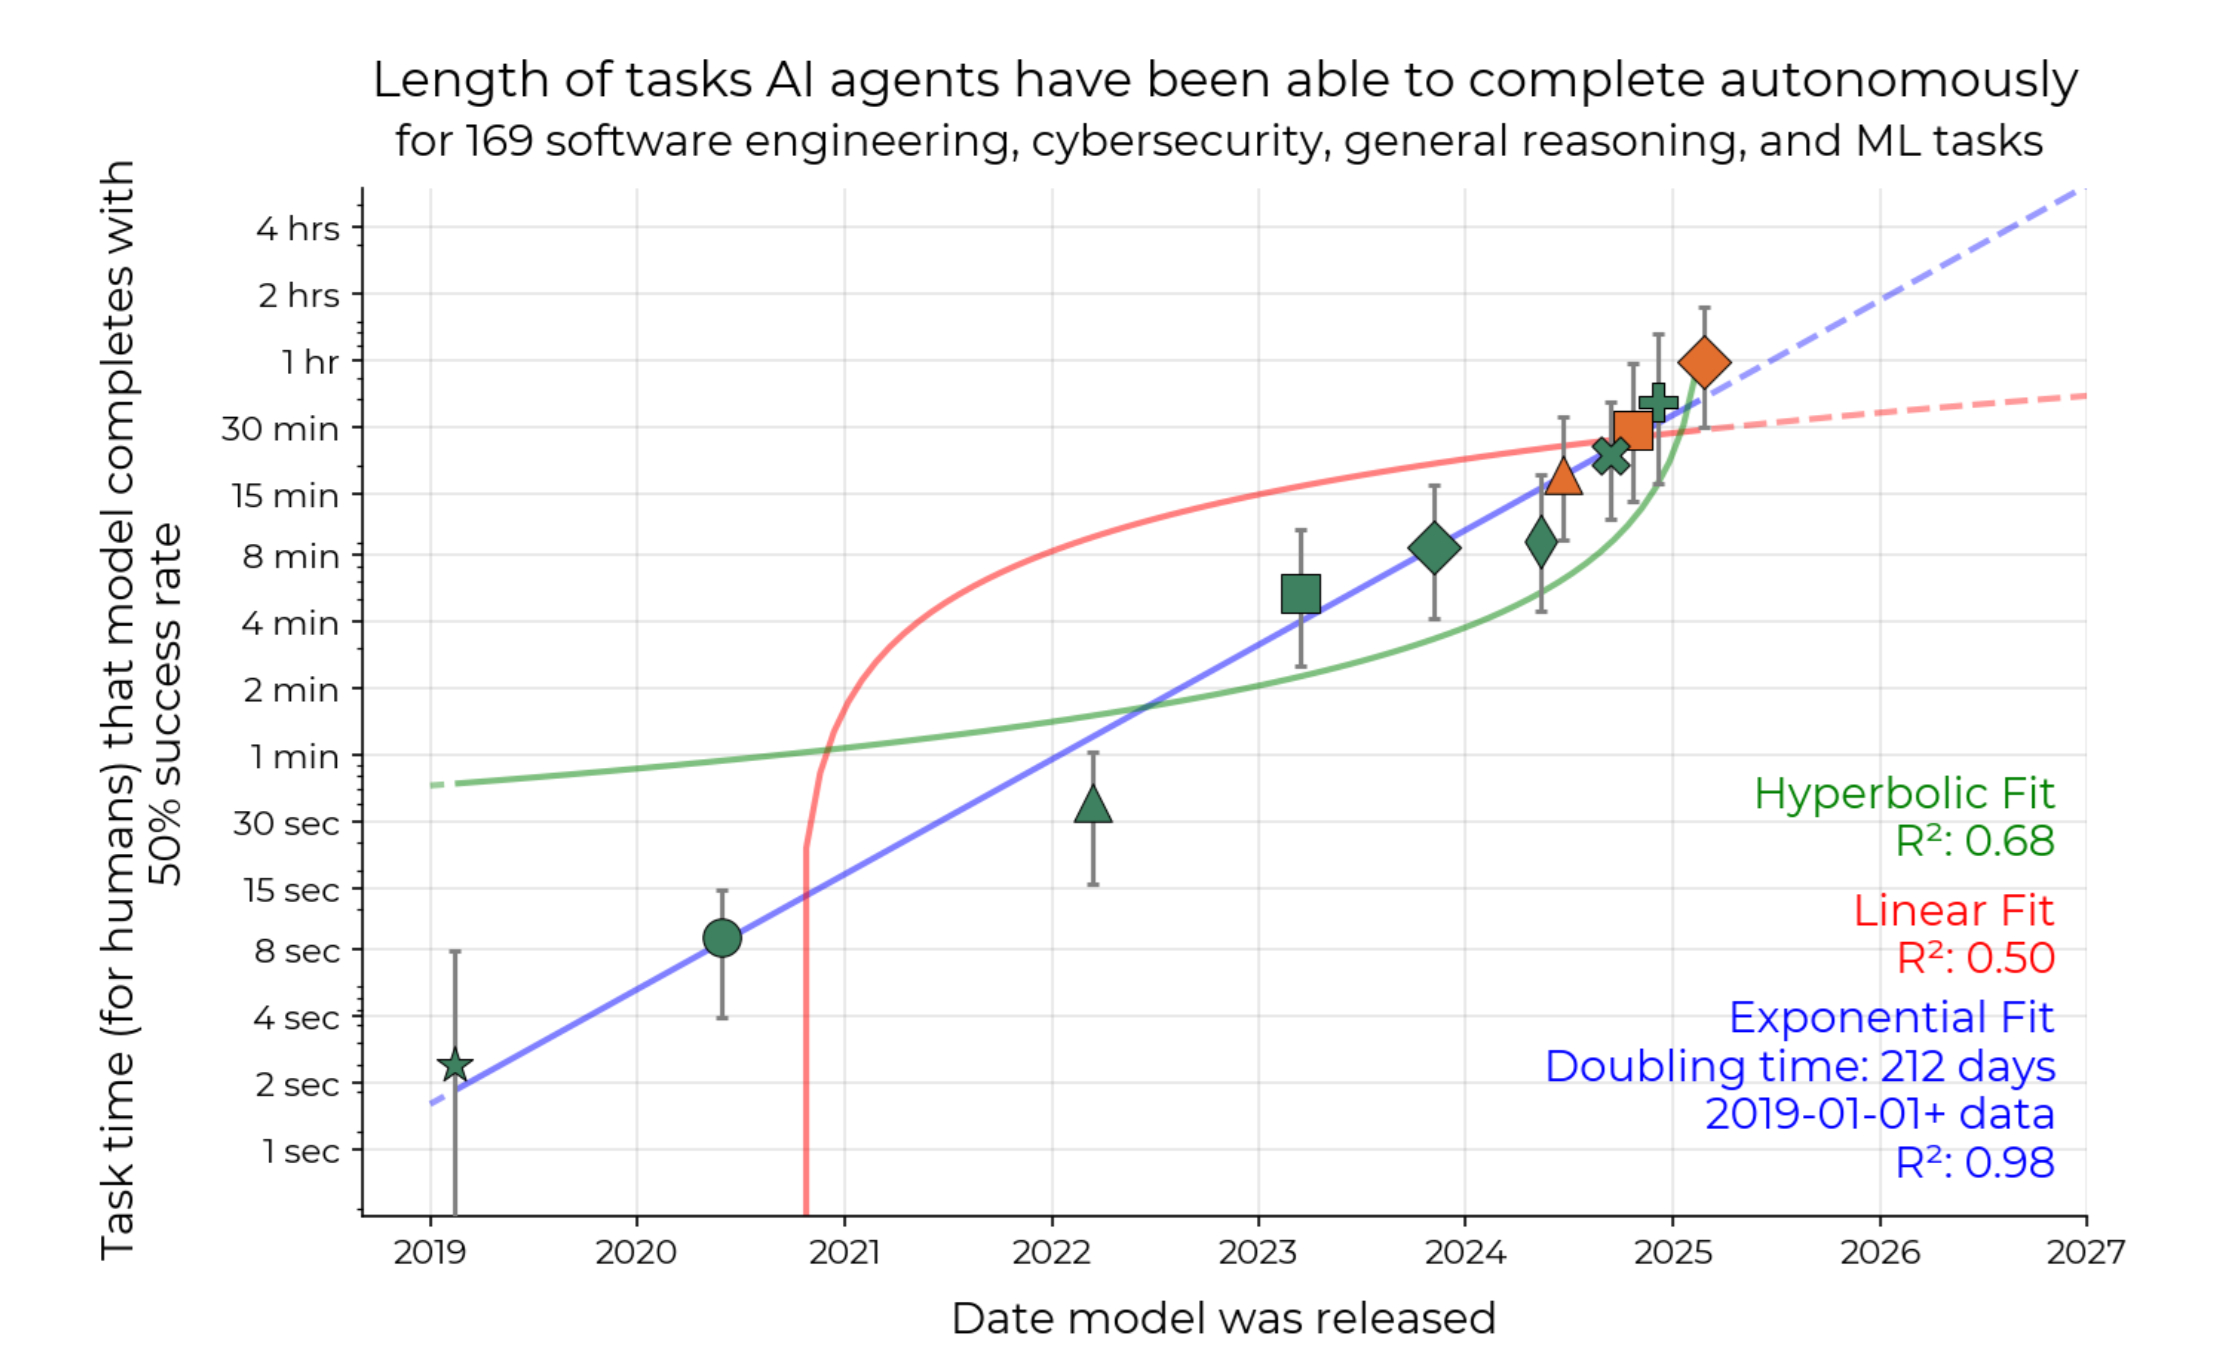
METR's other paper — Task-Completion Time Horizons of Frontier AI Models — answers exactly that. It does not measure "how long the AI can run before crashing." It measures the length of task an AI agent can complete at a given reliability threshold, where length is denominated in human-expert hours. A 50% time horizon of 10 minutes means: on tasks that take a human expert about 10 minutes, the AI succeeds roughly half the time.
Plot the last seven years of frontier model releases against that yardstick, and you get this curve:
METR time horizons — exponential fit at R² ≈ 0.98, doubling time roughly 212 days
source: METR, Task-Completion Time Horizons of Frontier AI Models (https://metr.org/time-horizons/)
212 days to double — which means Gary, when he restarted coding, caught an exponential curve still in acceleration. His 400× is not physically impossible.
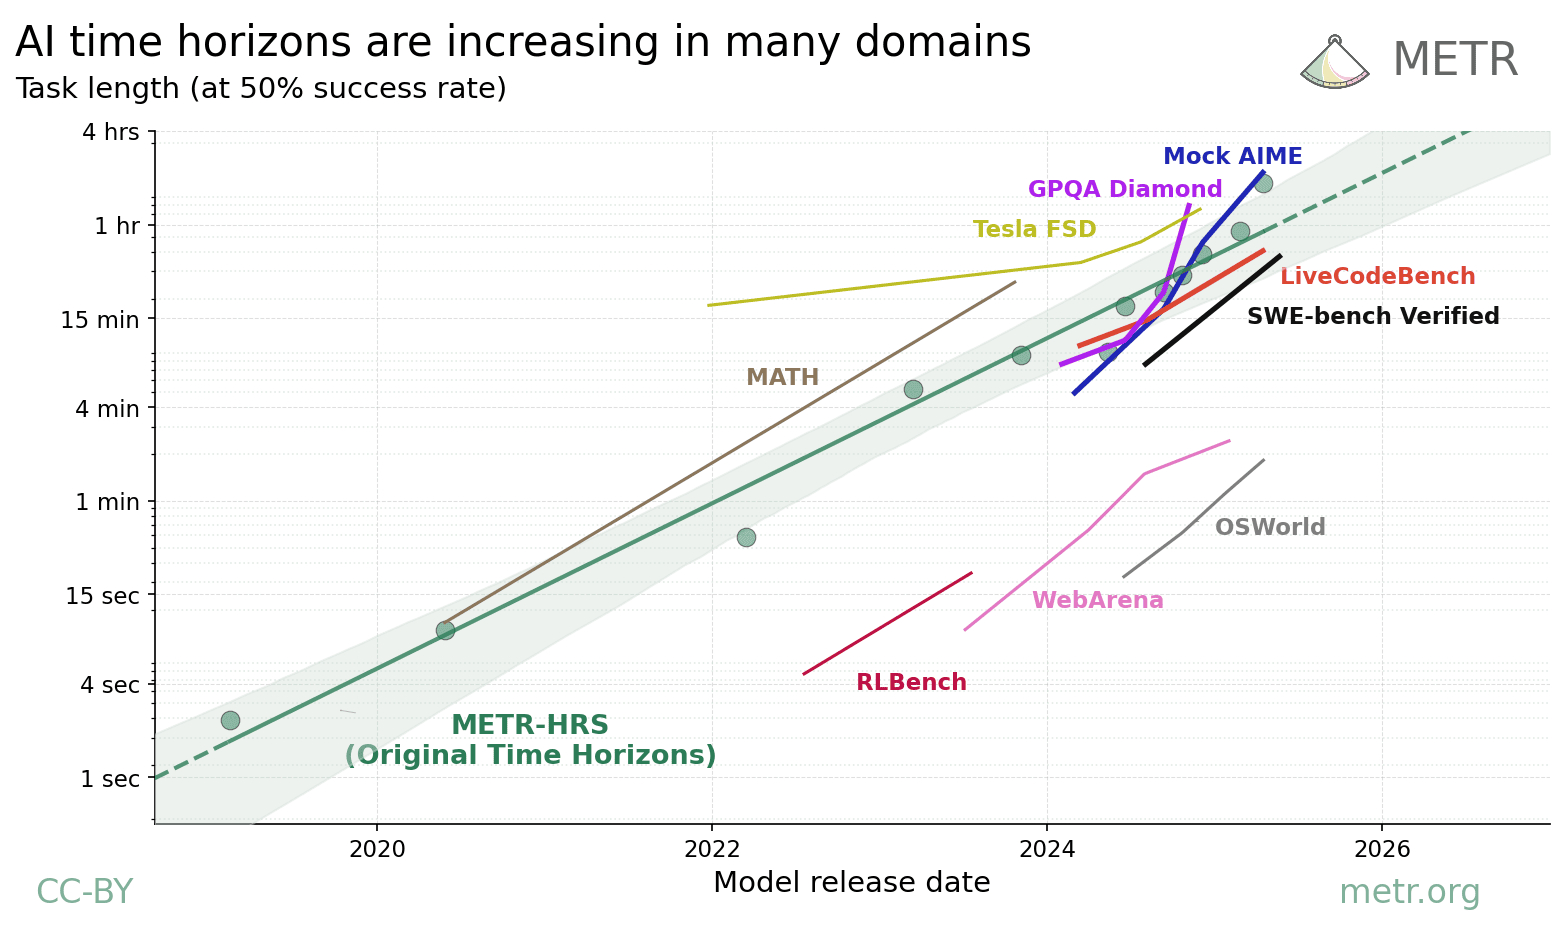
But METR spends serious airtime in the FAQ dis-mythologizing its own number. High-context vs low-context: the human baseline is built from "freshly-hired contractor" performance — you cannot extrapolate a 2-hour horizon to a high-context employee deeply embedded in a team codebase. Task cleanliness: every benchmark task is self-contained and auto-gradable, which most real-world work is not. And most important — capability is jagged:
AI capability shows pronounced jaggedness across domains
source: METR, Task-Completion Time Horizons of Frontier AI Models (same as above)
Jaggedness gives the within-group substitution mechanism its engine. Inside any real-world "task category" there will almost certainly be sub-tasks with large capability gaps. That fact lets us run a quiet stress-test on Anthropic's own research.
Tamkin and McCrory (2025) estimated that using Claude delivers about 17% overall productivity uplift. The chain: Claude is used on roughly 11% of compensation-weighted O*NET tasks, and within those tasks it cuts time by 80% (a 5× speedup). Under Hulten's theorem, the implied output gain is approximately 17% (≈ 0.11 × ln(5)).
By the three-yardstick framework, this 17% uses an ONET old-task basket, so it should be a lower bound* on real value uplift. But METR observes, sharply, that it's more likely an overestimate.
The reason is jagged capability plus within-group substitution. Inside the O*NET category "Prepare reports and memos," translating a paragraph into French (AI 5×) and synthesizing complex source material into a memo (AI not nearly as fast) are entirely different sub-tasks. Workers reallocate time heavily toward the AI-favorable sub-task — and researchers, observing only the speedup on the AI-favorable sub-task, record a 5× speedup against the entire category.
That's like watching you multiply on a calculator quickly and concluding you must be 5× faster at the whole calculus exam.
The same mechanism works on Gary's story. His workflow — CEO Plan → Plan Mode → Claude Code execution → Codex reverse review → Playwright UI tests — is itself a massive within-group substitution machine, intentionally engineered to route each sub-task to the agent best at it. That's clever engineering. It's also a setup that structurally guarantees the new-task yardstick will read enormous.
I wrote about this measurement problem before, in the context of OSWorld's 70% success rate. The conclusion was the same: you have to understand what is being measured before you can interpret the measurement. 17% is real. 70% is real. 400× is real. The trouble is — they're not measuring the same thing.
IV. Why Personal AI Sprints While Enterprise ROI Stutters
The same framework resolves a contradiction many readers find puzzling — why does a personal builder like Gary look like he's productivity-rocketing, while MIT's research shows enterprises collectively spent \$30bn–\$40bn on GenAI and most still cannot point to clean ROI?
The answer lives in the substitution friction on the right-hand side of Cunningham's inequality.
For individual users, substitution friction is nearly zero. Gary finds PR is cheap with Claude Code, so he writes more PRs. He finds OpenClaw unreliable, so he switches back to Claude Code. He notices a workflow recurring, so he encodes it as a Skill. Every reshuffling of his task mix is bottlenecked only by his own attention budget.
Enterprises are the opposite. Reshuffling tasks inside an enterprise faces a long friction checklist — access controls, data governance, audit requirements, accountability boundaries, KPI design, role definitions, compliance review. When AI prices a sub-task down by 5×, Gary can recompose his workflow in ten minutes. A public company might need ten months to translate that 5× speedup into the income statement.
MIT's "GenAI Divide" isn't proof that AI is useless. It's proof that the model-capability curve and the organizational-absorption curve are not the same curve.
METR's time horizons tell us how long a clean task the model can handle. The three-yardstick inequality tells us how individuals will reallocate time. But to turn that into enterprise value uplift, there's another gate to clear: embedding the new tasks into real workflows and producing measurable revenue / margin / quality outcomes.
Skip that gate and the enterprise tends to land on one of two illusions — either pretty old-task savings in the pilot deck (the old-task yardstick, underestimating but at least honest), or a flood of Cadillac tasks greenlit by IT departments (the new-task yardstick, wildly inflated and consisting largely of work that shouldn't have been done in the first place). The first looks like time saved; the second looks like volume produced. Neither necessarily translates into productivity on the P&L.
The organizations that do cross the GenAI Divide tend to be the ones that have hired — or grown internally — a "Gary-Tan-shaped individual" and given that person enough rope to recompose tasks at will. That's its own essay.
V. The Last Unbent Yardstick — Science and Art Revisited
If you've followed me this far, you've probably noticed the same idea getting pointed at from several different directions.
I wrote, in Taste Is the Last Moat, about a binary distinction. Everything standardizable, executable, and verifiable I called Science; what's left over — "decide what your 50 interns should research, decide what's worth researching" — I called Art. The judgment then was: AI is pushing the marginal cost of Science toward zero, but it cannot do your Art for you.
METR's inequality is, in effect, the same intuition in stricter economic form.
Uplift on old tasks is the easiest yardstick to read on the Science side. Most earnings releases, most sell-side "AI delivers 80% speedup on X" reports, most enterprise pilot KPIs measure exactly this. It necessarily underestimates.
Uplift on new tasks is what happens when Science gets pushed to extreme cheapness and the absence of Art judgment lets people pile in. The numerator fills with Cadillacs — boiled-ocean reports, immaculate end-to-end tests on PRs that shouldn't exist, translation sub-tasks run 20 times then logged as "category 5×." It necessarily overestimates.
Uplift in value isn't in the Git commit. It isn't in the O*NET basket. It isn't in any report's executive summary. It lives in one place — your judgment.
I wrote last year, in The Efficiency Illusion, about an Anthropic–Stanford collaboration that found AI Delegation learners scored 39% on the final assessment, while Generation-Then-Comprehension learners scored 86%. What struck me at the time: task completion is not capability. METR's inequality completes the other half — task completion is not value, either.
Does Gary's 400× contain genuine value uplift? Without question. In that interview he explained why he decided to redo Posterous a third time — he wanted the same platform to push San Francisco's algebra-education problem, something he cares about personally because he himself came up through East Bay public schools. "I want kids who can't afford private school, like me, to learn." That's his self-defined Art. That part cannot be substituted.
It's also why his "personal AI" thesis — owning your own prompts, your own data, your own integrations — rings more honest than any enterprise AI-transformation deck. I live inside that same architecture: roughly \$300 a week in tokens, around 300mn tokens of throughput, about 95% of my research tasks delegated to AI (I wrote about that in My AI Stopped Chatting and Got to Work). Inside a workflow like that, the value yardstick isn't pre-calibrated for you. You re-calibrate it every day.
Coda: The Question Behind the 400×
Back to Gary.
At the end of the interview he said something I keep coming back to: "Will you own your tools, or will your tools own you?"
His answer is personal AI — own your prompts, your data, your integrations, like a Homebrew Computer Club hobbyist assembling a kit-car Ferrari in the garage. I agree with that thesis, and I live inside it daily.
But I want to add a patch. In an era where numbers like 400× are turning into standard LinkedIn openers and AI productivity reports cascade out like Cadillac fire-sale ads, owning your tools is only half the problem. The other half — own your yardstick.
The next time someone tells you a tool sped up a process by 90%, that a company achieved a 17% overall productivity lift with AI, or that an engineer built a year of work on a \$200 Claude account, the first move isn't to gasp. It's to pause and ask: which yardstick am I reading right now?
Is it Uplift on old tasks — the floor that underestimates the real change?
Is it Uplift on new tasks — the ceiling propped up by Cadillac Tasks?
Or is it Uplift in value — the number sandwiched between the other two, unobservable except through your own judgment?
METR's time-horizon curve tells us AI's capability ceiling is doubling roughly every 212 days. That's real. But between capability ceiling and realized value there will always sit one layer — judgment.
So the question worth asking yourself, ultimately, isn't "will AI save me time?"
It's this — once machine time becomes nearly free, where do you want to spend your human time?
Until you can answer that one honestly, the 400× engineer isn't going to replace the analyst.
It'll just make an analyst who can't read a yardstick look more useless than ever.


