
AI Investment Boom - Assessing Macro Bubble Risk, the $5T Infrastructure Buildout's Funding Gap, and the Impact of Lease Accounting on FCF
With a $5 trillion AI infrastructure buildout on the horizon, is the greatest risk not a market bubble, but the physical limits of our power grid and the $1.4 trillion funding gap that only complex financial engineering can bridge?


The 1997 Moment for AI Investing: The Eve of a Bubble, or the Prelude to a New Cycle?
History doesn't repeat itself, but it often rhymes. As Nvidia's market cap soars past one milestone after another and hyperscalers announce capex plans in the hundreds of billions, a haunting question lingers in every investor's mind: Are we reliving the dot-com bubble of the late 1990s? The air is thick with optimism, laced with a disquieting sense of familiarity. Yet, a deeper look into the fabric of the macroeconomy reveals that the current AI investment frenzy is fundamentally different from the "macro-bubbles" of the past. This may not be the fever pitch of 2000, but rather the prelude to the party in 1997—a moment brimming with opportunity, yet heralding the challenges to come.
Historical Echoes: How to Identify a True "Macro-Bubble"
To understand where we stand, we must first define a true "macro-bubble." It's far more than just inflated asset prices; it's a systemic imbalance that distorts spending and capital flows across the entire economy. The tech bubble of the 1990s and the housing bubble of the mid-2000s are textbook examples.
Looking back at the 1990s, the tech stock mania was accompanied by a series of clear macroeconomic signals:
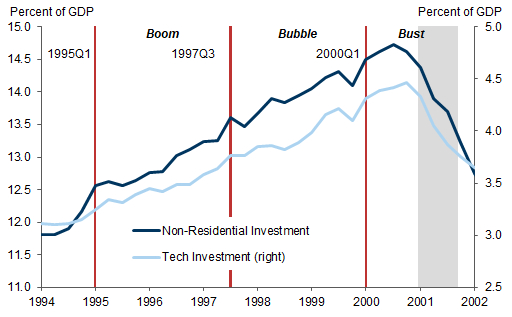
- A Widespread Investment Boom: From 1995 to 2000, investment in tech equipment and software surged from just over 3% of GDP to a record 4.5%. Broader non-residential investment also climbed from around 11% of GDP to nearly 15%. This was a society-wide capital flood.
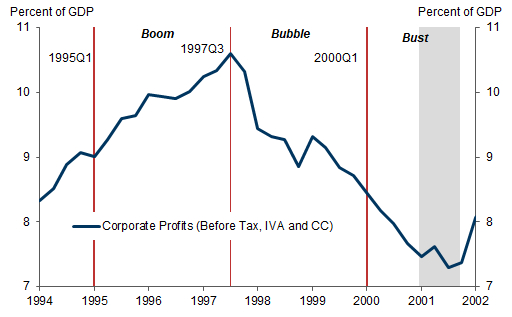
- Peaking and Declining Profitability: Corporate profit margins peaked in late 1997 and began to decline as a tight labor market pushed up wages and unit labor costs.
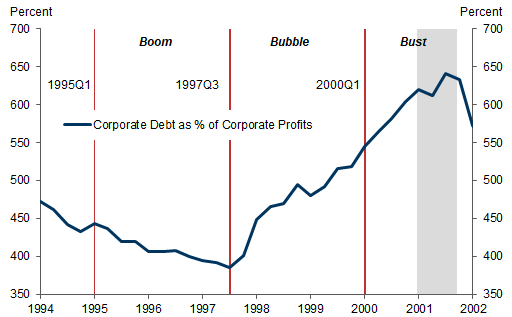
- A Sharp Rise in Leverage: The corporate sector swung from a financial surplus to a deficit, borrowing heavily to finance investments, especially in the telecom sector. Meanwhile, the household savings rate fell due to the wealth effect.
- External Imbalances and Market Anomalies: The Asian and Russian financial crises of 1997-1998 drove a flood of capital into US markets. The Fed's "insurance" rate cuts to fend off risks further fueled the Nasdaq's decoupling from the broader market, while credit spreads and market volatility widened.
Widespread Investment Boom
(Source: Goldman Sachs)
Profit Share Rose but Peaked in Late 1997
(Source: Goldman Sachs)
Corporate Debt Rose Sharply from Late 1997
(Source: Goldman Sachs)
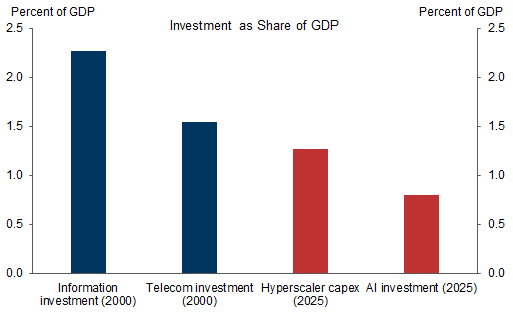
In contrast, the current AI boom appears much "cooler" on a macro level. Although capex from AI-related companies has reportedly doubled, its scale and duration are far from what we saw in the late 1990s. AI's contribution to GDP remains modest. More importantly, we are not seeing the kind of broad-based investment mania that spread across all industries back then. Corporate profit margins remain robust, balance sheets are generally healthy, and the corporate sector is still in a financial surplus rather than borrowing heavily. Credit spreads remain tight, and market volatility has not seen a sustained increase.
All this points to one conclusion: If the 1990s tech boom was a massive party, we may have only just entered the warm-up act of 1997, not the final frenzy of 2000 before the music stops.
AI Capex Smaller than in Past Booms
(Source: Goldman Sachs)
The Shackles of the Physical World: The $5 Trillion Investment's Power Bottleneck
However, even with a stable macro environment, AI's journey to the stars is not without obstacles. Behind the exponential growth of the digital world lie the heavy shackles of linear growth in the physical world.
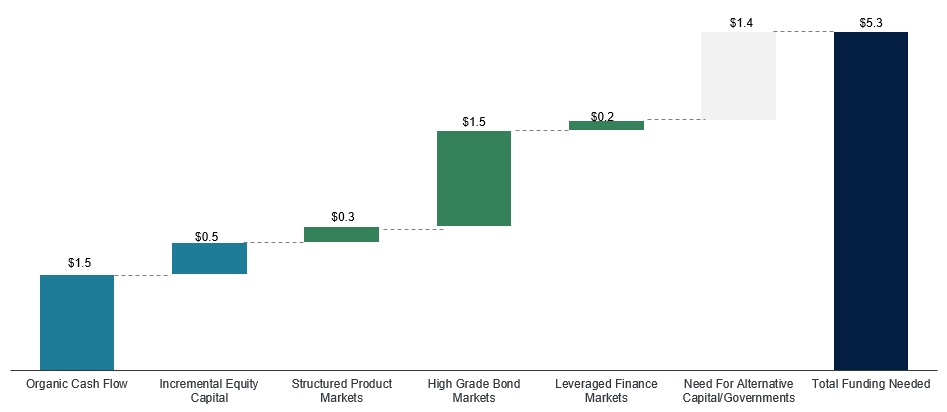
J.P. Morgan estimates that the total investment in global AI and data center construction could exceed a staggering $5 trillion. By 2030, the annual funding requirement alone could surpass $1.4 trillion. But money isn't the only problem, or even the biggest one. The primary bottleneck is power.
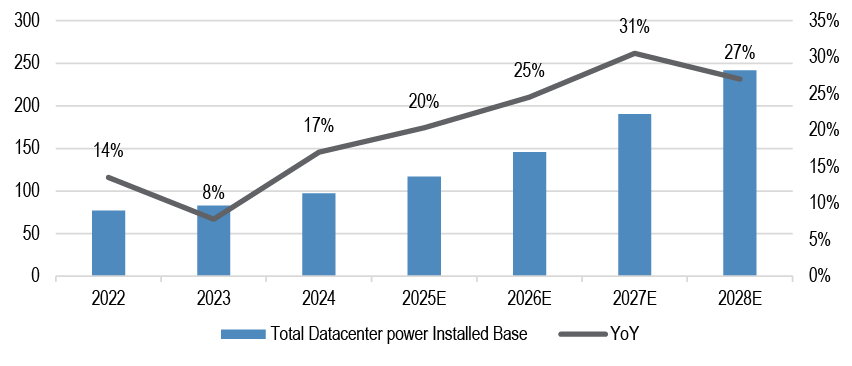
Building data center clusters capable of supporting next-generation AI models requires an unprecedented amount of electricity. It's estimated that the US alone needs to add at least 100 GW of new generation capacity to feed the appetite of data centers—nearly equivalent to the entire power capacity of the UK. Building new power facilities, whether natural gas, nuclear, or renewables, takes years, if not decades. Upgrading the power grid is equally time-consuming. Hyperscalers are already taking action, signing long-term Power Purchase Agreements (PPAs) directly with utility companies and even pushing to restart nuclear plants, but this race against time has only just begun.
Data Center Power Capacity and YoY Trends
(Source: JPM)
Financial Alchemy: How to Fill the $1.4 Trillion Funding Gap?
Faced with a colossal $5 trillion investment and the constraints of the physical world, hyperscalers are turning to an increasingly complex financial toolbox. While traditional internal cash flows and the high-grade bond markets are the mainstays, they are far from sufficient to cover the entire need.
According to J.P. Morgan's calculations, even after tapping internal cash flow, equity, structured products, and public bond markets, a funding gap of up to $1.4 trillion will remain by 2030. This shortfall will largely need to be filled by private credit and more innovative structured financing.
AI/Data Center Sources of Funds
(Source: JPM)
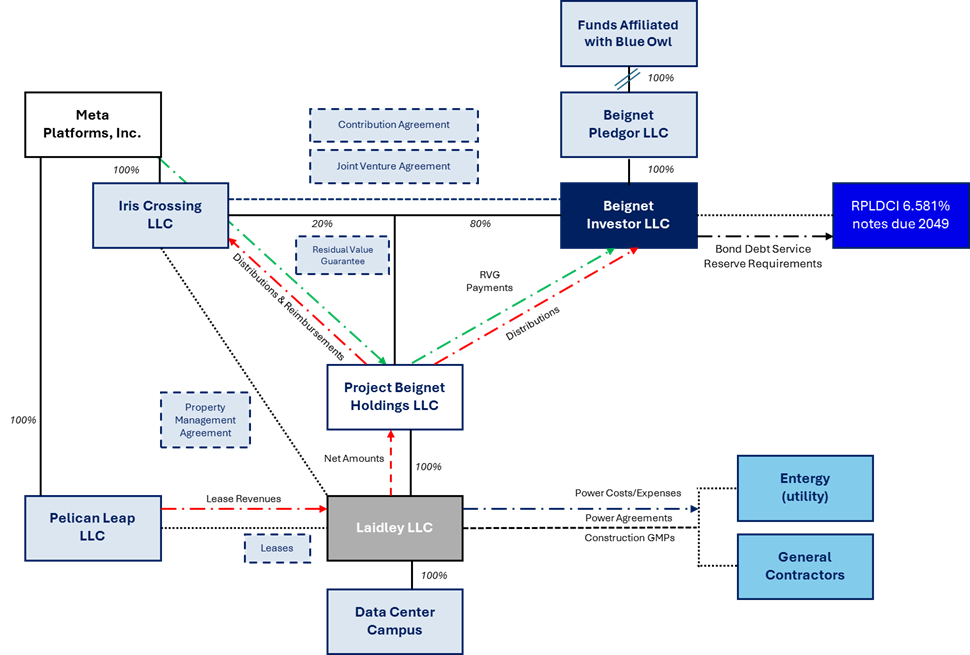
Meta's recent Beignet Investor LLC transaction is a perfect illustration of this trend. By creating a complex Special Purpose Entity (SPE), Meta successfully transformed a $2.73 billion data center construction investment from a direct capex and debt obligation into a long-term, off-balance-sheet lease. This structure not only brought in capital from private credit funds but also optimized Meta's balance sheet. We can expect to see more similar financial innovations in the future.
Beignet Investor LLC Organizational Structure
(Source: JPM)
The "Accounting Magic" of Leasing: The Truth About Free Cash Flow
Against this backdrop, leasing—particularly finance leases—is becoming a key tool for hyperscalers to accelerate their expansion. It's projected that up to 20% (about $400 billion) of their capital investments over the next three years will be realized through finance leases for data center shells.
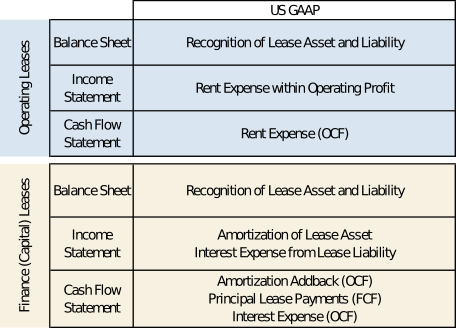
However, this shift presents new challenges for investors. Under US GAAP, finance leases and operating leases are treated very differently on financial statements:
- Income Statement: The costs of a finance lease are split into depreciation and interest, creating a "front-loaded" expense pattern. In contrast, an operating lease has a smooth, straight-line rent expense.
- Cash Flow Statement: This is where the key difference lies. All payments for an operating lease are recorded in Cash Flow from Operations (CFO). For a finance lease, the payment is split: interest goes to CFO, while the principal repayment is recorded in Cash Flow from Financing (CFF).
Accounting Impact of Finance vs. Operating Leases under US GAAP
(Source: Morgan Stanley)
This accounting discrepancy means that as a company increasingly uses finance leases, its reported CFO and Free Cash Flow (FCF) will look better because the large principal payments are "hidden" in the financing section. At the same time, its reported capex will be understated, as it doesn't fully reflect the true economic outlay to acquire the asset.
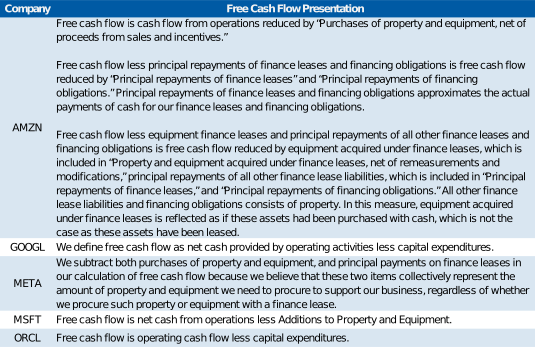
Furthermore, how companies calculate FCF varies wildly. For example, Amazon and Meta subtract finance lease principal payments in their custom FCF metrics, while Google, Microsoft, and Oracle do not. This makes cross-company comparisons extremely difficult. For investors, it is imperative to pierce through the fog of financial statements and incorporate assets acquired via finance leases and their principal payments to accurately assess a company's true capital intensity, leverage, and cash generation capabilities.
Hyperscaler Free Cash Flow (FCF) Presentation
(Source: Morgan Stanley)
The Ultimate Test: Monetization, Disruption, and Investment Takeaways
Returning to the original question: Is this a new, sustainable era? The answer ultimately hinges on the oldest law of business—monetization.
For this $5 trillion investment to achieve a 10% Internal Rate of Return (IRR), the entire ecosystem needs to generate about $65 billion in new annual revenue. This is an astronomical figure, equivalent to every Netflix subscriber worldwide paying an extra $180 per month, or every iPhone user paying an extra $35 per month. Whether AI can create such immense value remains an open question.
Meanwhile, the risk of disruption from rapid technological iteration looms large. Just in January 2025, a little-known Chinese startup, DeepSeek, released a model that claimed to achieve top-tier performance at a fraction of the cost, briefly wiping hundreds of billions off Nvidia's market cap. It's a stark reminder that today's seemingly unshakeable computational dominance could be challenged by a new paradigm tomorrow.
For investors, although a full-blown macro-bubble has not yet formed, cautionary signals are beginning to flash. Corporate financial balances are deteriorating, and debt financing and complex supplier financing arrangements are on the rise. In this environment, keen observation is critical. We must closely monitor the macro indicators that portend a bubble: Is the investment rate spiraling out of control? Have profit margins peaked? Are credit spreads and market volatility starting to climb?
We may be at the dawn of a great era of technological transformation, but the journey is destined to be anything but smooth. While enjoying the party, it's crucial to keep an eye out for which corner of the room is starting to smoke.
I will share a more detailed version of this post behind the paywall with more charts and anlysis.


