
The Bill Is Outrunning the Revenue - Why the AI Trade Has Become Hard to Sustain
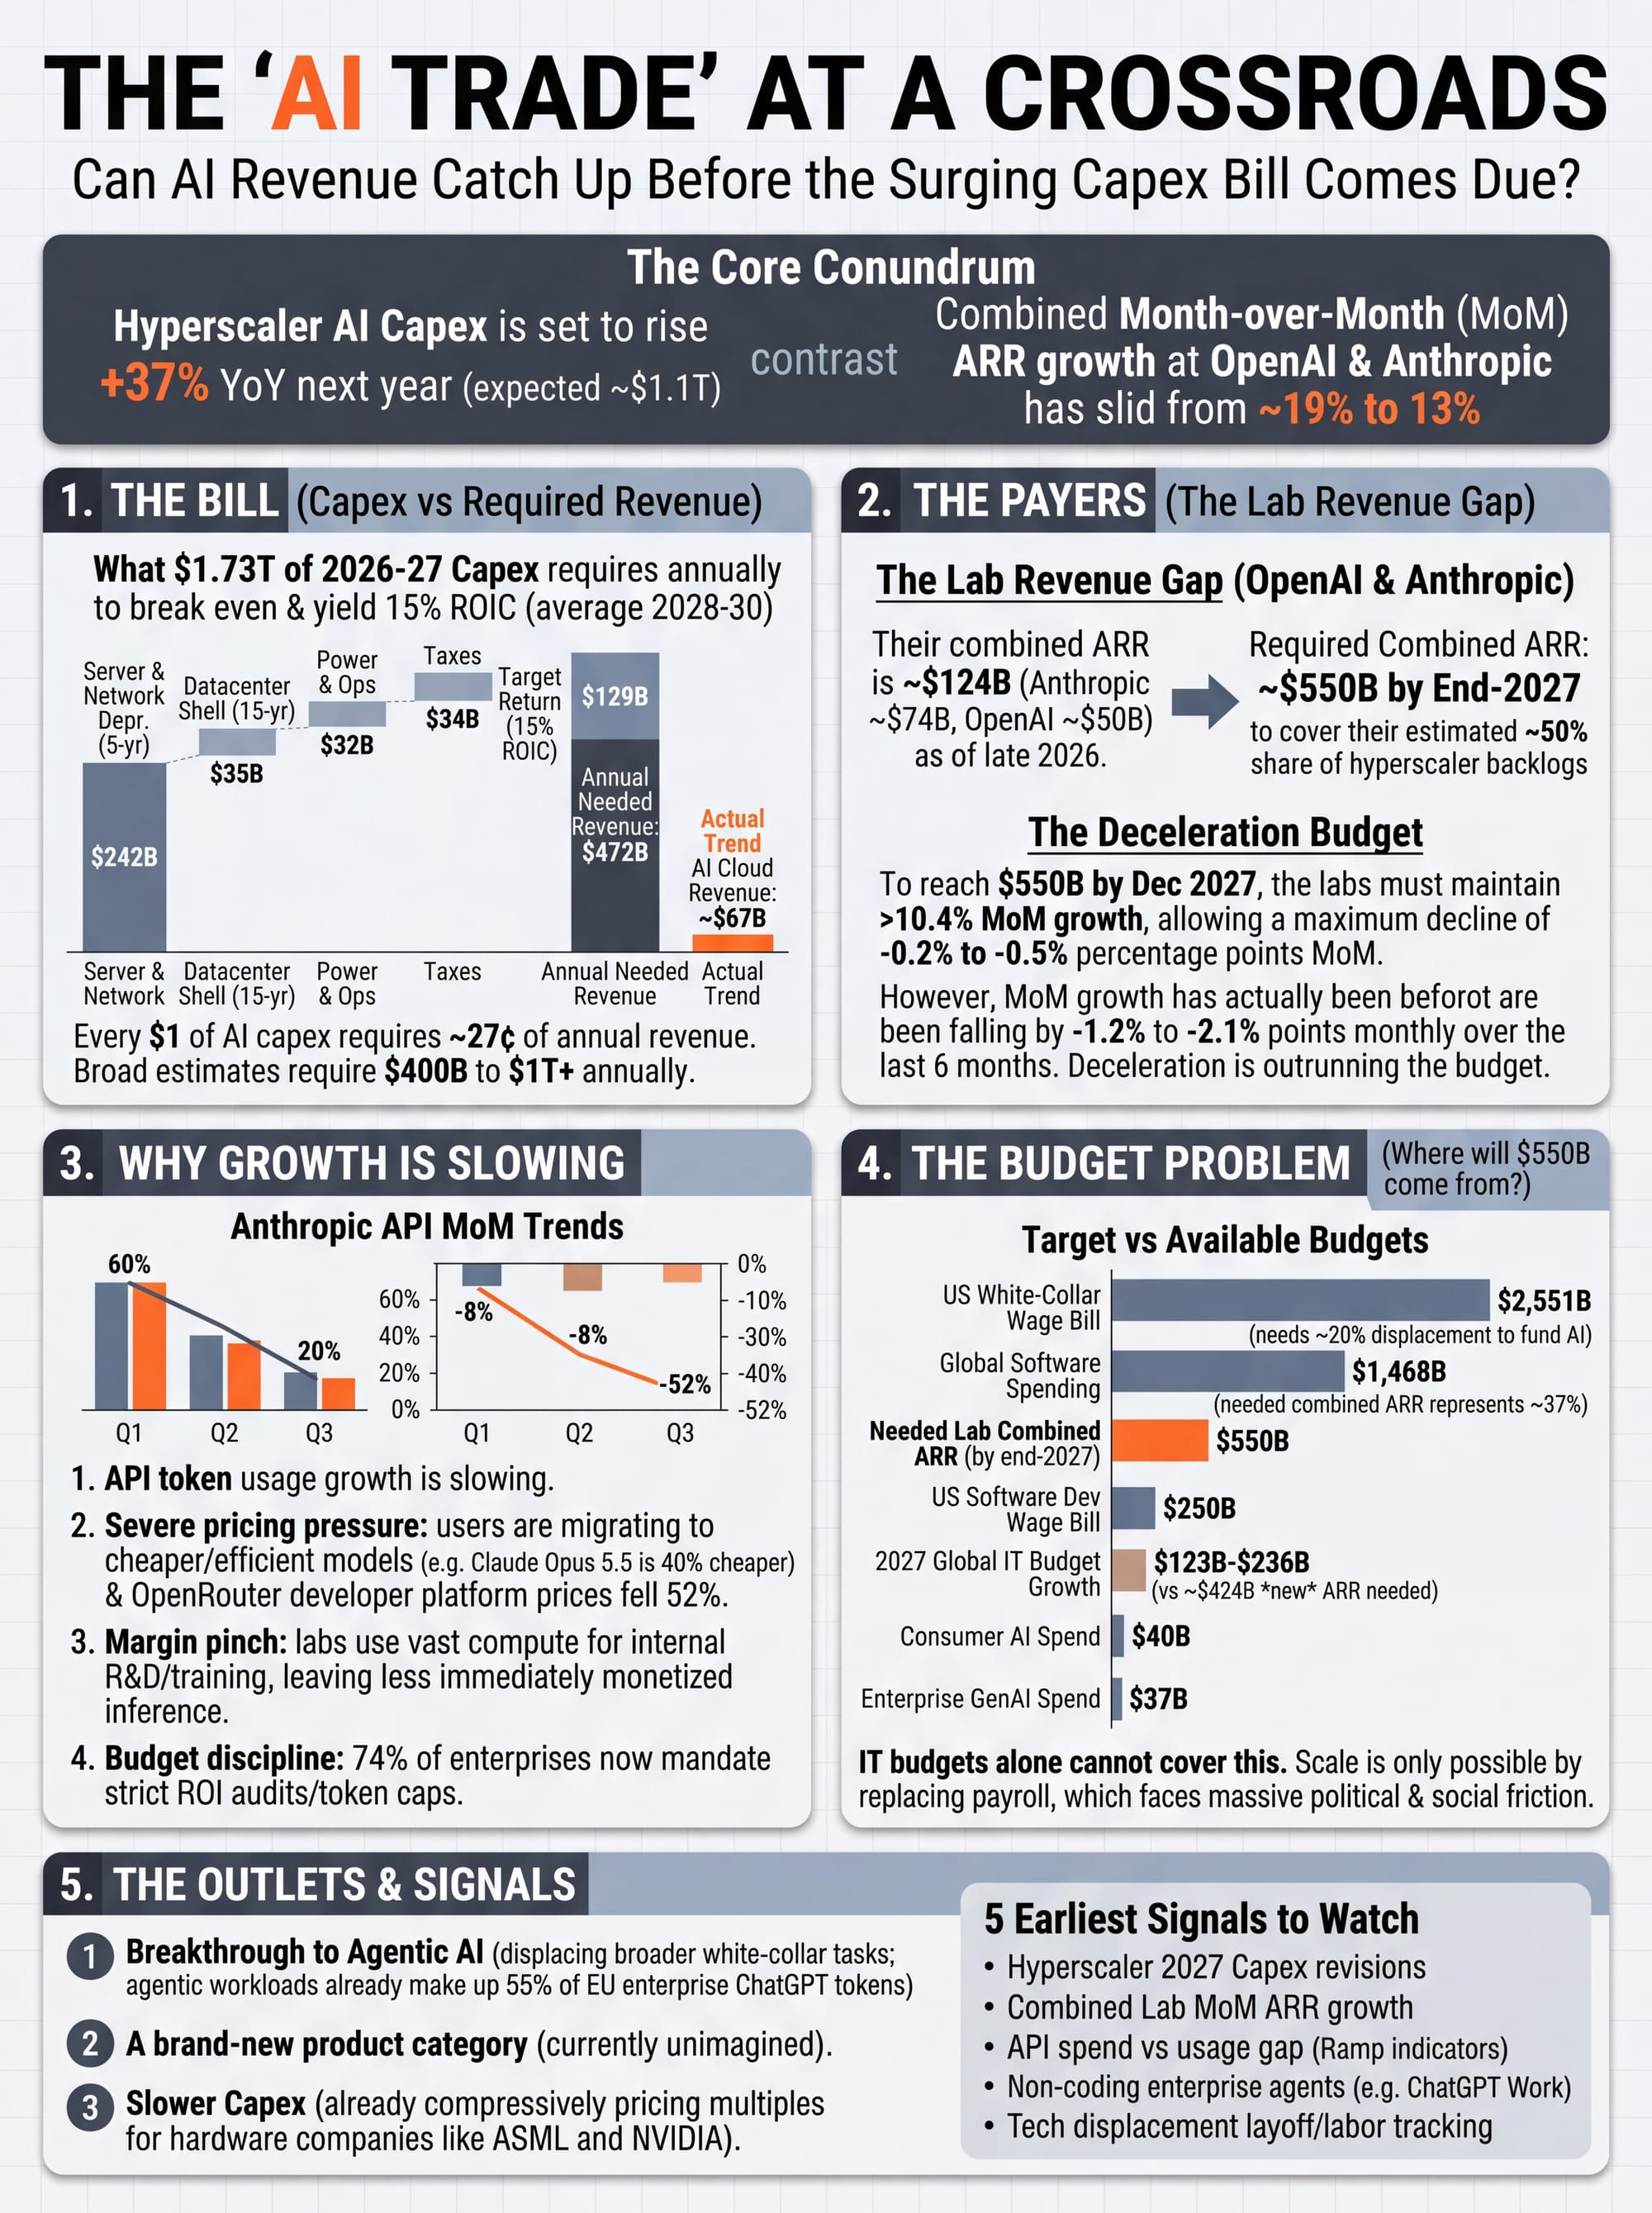
Hyperscaler capex is set to rise another 37% next year, while month-over-month ARR growth at OpenAI and Anthropic, the two labs expected to cover about half of the AI bill, has slid from about 19% to 13%. Can their revenue catch up before the bill comes due?


On October 14, Anthropic spent a full day hosting investors at its San Francisco office. According to the Financial Times (FT) and Reuters, citing people who attended, third-quarter revenue came in at \$16.8bn, up about 45% on the prior quarter. The company has now posted an adjusted profit for two quarters running.
For almost any company, that would be a handsome report card. The trouble lies in the comparison with the quarter before: second-quarter revenue grew more than 140% sequentially, and the third quarter managed only about a third of that pace.
Anthropic did not update its annualized revenue (ARR), the full-year figure extrapolated from its most recent stretch of sales. SemiAnalysis, a research firm, puts it at about \$74bn based on the new numbers. As recently as the summer, several investors told the FT the figure would be "well above \$100bn" by year-end.
The market fell that same week. The PHLX Semiconductor Index lost about 12% over the seven trading days from October 7 to October 15. Its worst single session was the day of the investor event, when it dropped 4.3%.
On October 15, Hong Kong-listed Zhipu AI, MiniMax and Biren Technology each fell more than 10%. More than one force was at work: rate-hike expectations, technical progress at Chinese memory maker CXMT, and the cost of financing AI data centers all crowded into the same week. I don't want to pin all of it on a single investor day. Explanations are always easy to find after the fact.
In February, in my NVIDIA 4Q26 earnings review, I wrote: "GPUs produce tokens; tokens produce revenue; revenue justifies CapEx. This loop is closing." A token is the unit in which a model reads and writes text, and model companies bill their customers by the token. Back then the sentence had data behind it: the combined annualized revenue of OpenAI and Anthropic was growing about 25% a month.
Eight months on, the loop is still turning, but its two ends are moving at different speeds. The spending end keeps getting revised up: consensus for next year's capital expenditure (capex) at the five largest US hyperscalers is about \$1.1tn, 37% more than this year, and up from just \$630bn at the start of the year.
The earning end has begun to slow. Month-over-month growth in the two labs' combined annualized revenue fell from an average of about 19% in the first half to about 13% in the third quarter, and to about 12% in September.
By "the AI Trade" I mean the family of assets that are a bet on AI capex continuing to grow: chips, memory, networking, power, and the model companies preparing to go public. This piece only does the arithmetic on revenue and the bill. Whether share prices are too high or too low, I leave to the reader.
The question I want to answer is whether revenue can catch up before the bill comes due. On current trends, my answer is no. Three things could change that answer: model capability climbing another step, a product nobody can see today, or a slowdown in capex.
How large the bill is depends on whose method you use, but most estimates land between \$400bn and \$1tn of AI revenue a year. About half of it falls to OpenAI and Anthropic. At the middle tier, that means the two labs need combined annualized revenue of roughly \$550bn by around the end of 2027.
Today they stand at about \$124bn combined: roughly \$74bn for Anthropic and \$50bn for OpenAI. To get there on time, monthly growth has to hold above 10%, and it can afford to slow by no more than 0.2 to 0.5 percentage points a month. Over the past six months, it has slowed by more than 1.2 points a month on average.
Even if growth holds, customers would be paying the two labs about \$550bn a year for tokens, equal to 37% of global software spending. Software budgets cannot absorb a number that size. The only pool of money on that scale is payroll.
Part One: The Bill. A Reasonable Return Needs \$400bn to \$1tn of AI Revenue a Year
Every institution that prices this bill uses the same arithmetic. Once a dollar of capex has been spent, it must cover its depreciation every year, pay for power and staff, pay its taxes, and still leave a return for whoever put up the money. Add those four together and you have the revenue that dollar needs each year.
How much revenue a dollar of capex has to bring back
A September report from Goldman Sachs (GS) lays out this arithmetic more transparently than anyone else. It covers about \$1.73tn of AI capex across six US hyperscalers (Alphabet, Amazon, Microsoft, Meta, Oracle and SpaceX) in 2026 and 2027.
Seventy percent of that money goes into servers and networking, depreciated over five years, or about \$242bn a year. The other 30% goes into data-center shells, depreciated over 15 years, or about \$35bn a year. Add roughly \$32bn of power, labor and other operating costs, and \$308bn of revenue a year merely breaks even.
GS asks for a 15% return on invested capital (ROIC), which works out to about \$129bn of after-tax profit a year, plus about \$34bn of tax. Put it all together and the six need an average of \$472bn of revenue a year in 2028–2030. Put differently, every dollar of capex has to bring back about 27 cents of revenue, every single year.
How much revenue a dollar of capex has to bring back each year: GS's \$472bn, built up
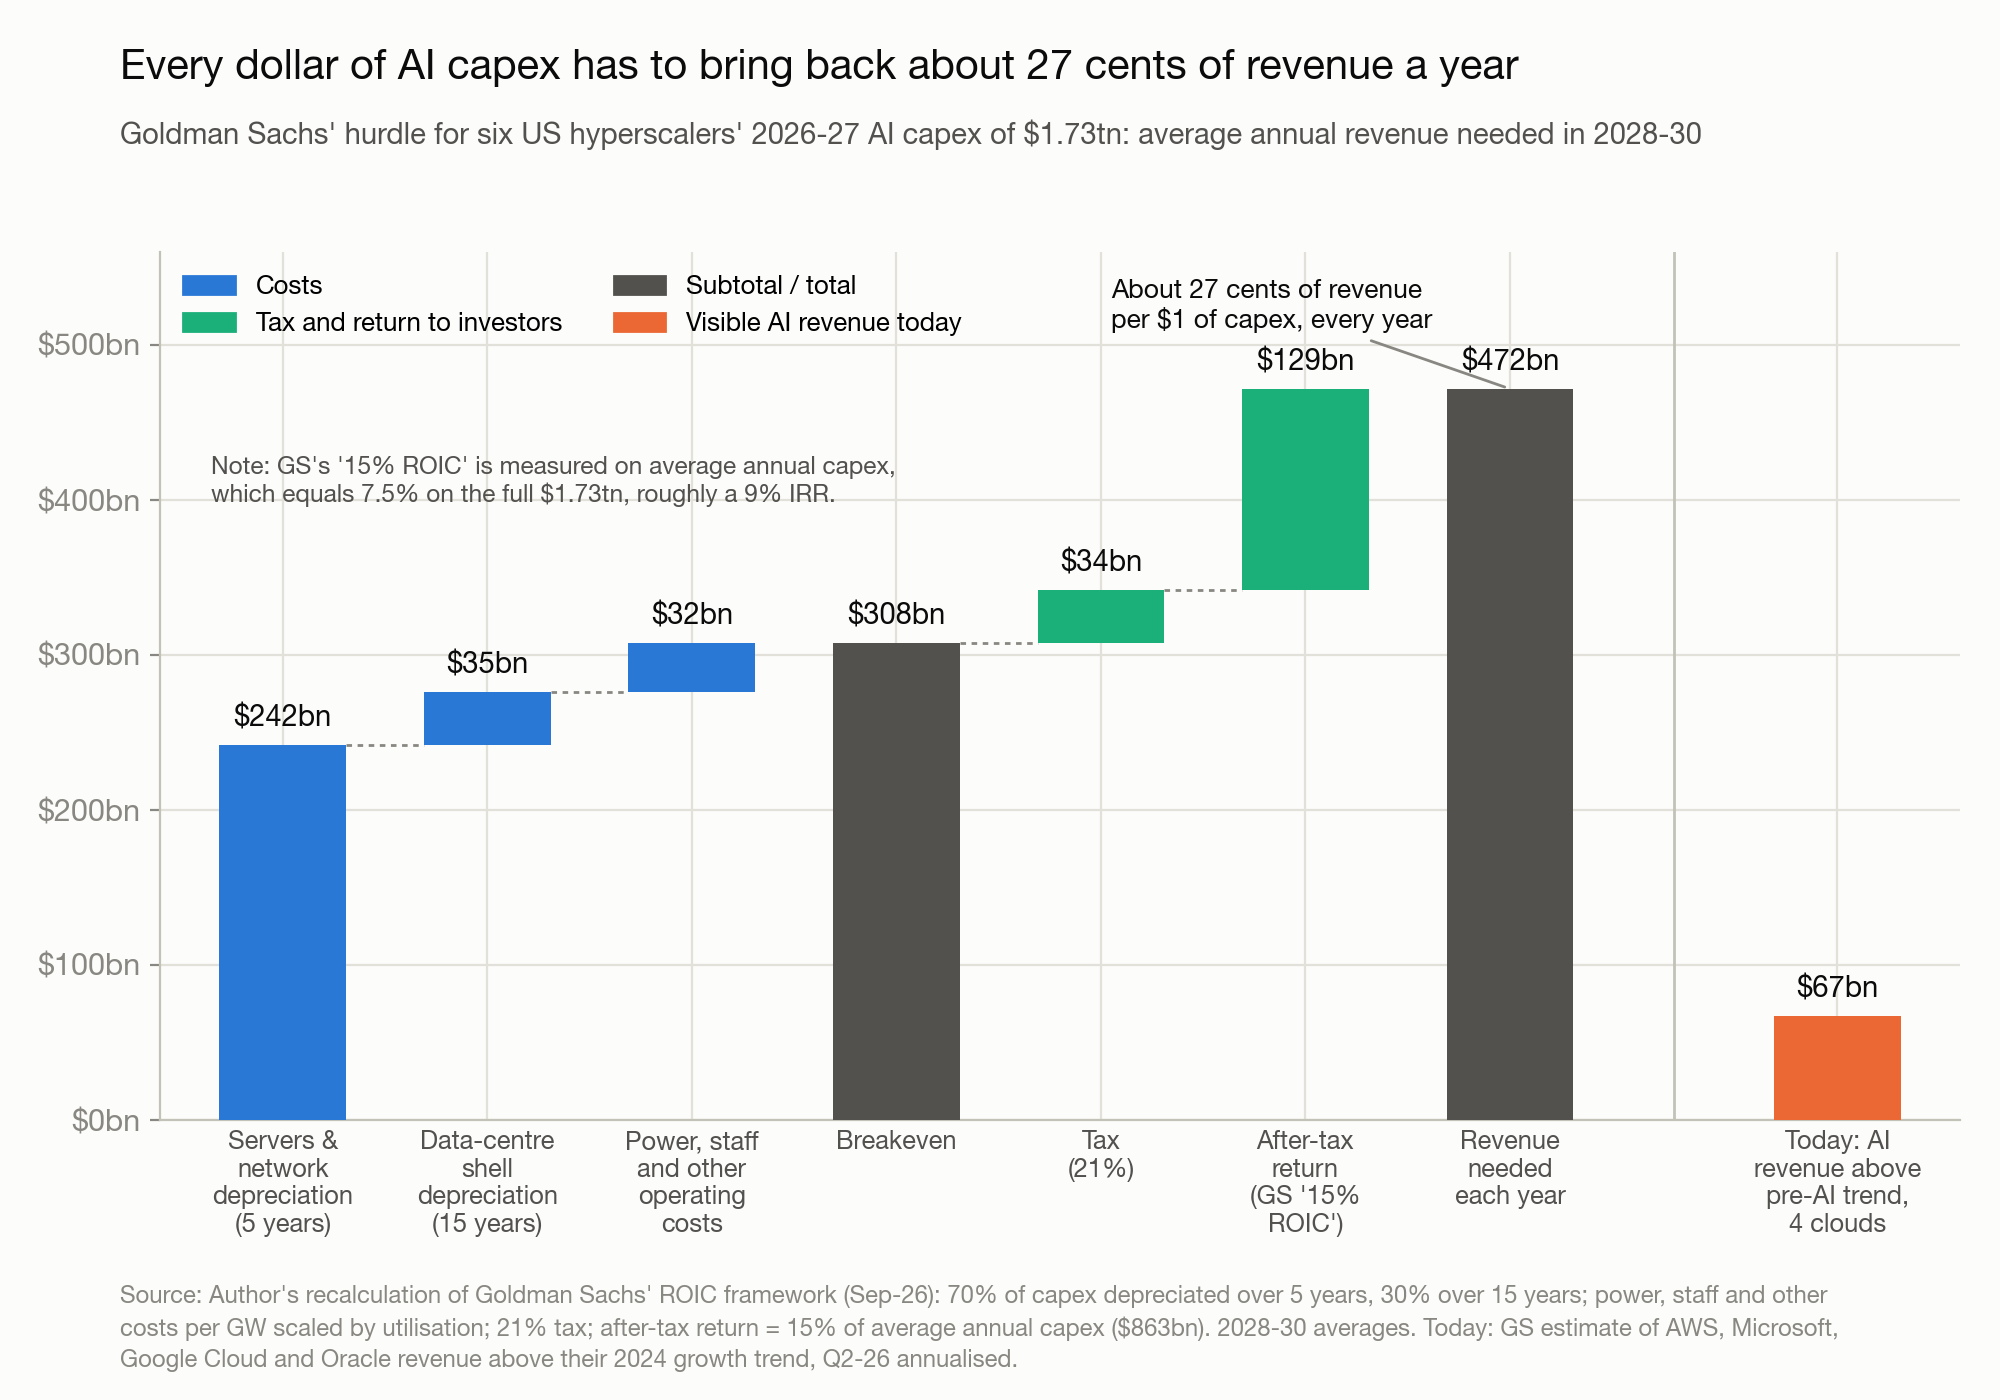
source: Author's recalculation of Goldman Sachs' ROIC table (2026-09), 2028–2030 averages. Seventy percent of capex is depreciated over 5 years and 30% over 15. Operating costs are power, labor and other costs per GW, scaled by utilization; the tax rate is 21%. After-tax profit equals 15% of average annual capex (\$863bn). The bar on the right is GS's estimate of the four clouds' revenue above their 2024 growth trend, Q2 annualized.
Depreciation makes up nearly 60% of the required revenue, which makes useful life the most sensitive assumption in the model. Depreciate servers and networking over three years and the hurdle climbs to about \$633bn; stretch it to six and it falls to about \$431bn.
That 15% also deserves a discount. GS's denominator is average annual capex across the two years, about \$863bn, while the money actually deployed is the two-year total of \$1.73tn. Spread the same profit over the full investment and the return is only about 7.5%. By my own recalculation, the internal rate of return is about 9%.
So \$472bn is closer to a passing grade: just enough to cover the cost of capital.
Different numbers, three different choices
Published estimates run from about \$300bn a year to well over \$1tn, yet the arithmetic underneath is identical. The differences come down to three choices: how much capex you count, how high a return you demand, and at which layer you measure revenue.
The first choice is how much capex to count. GS counts only the 2026–2027 cohort; the money already spent in 2023–2025 is asked for no return at all. Bring those years in with the same method and I get a hurdle of about \$645bn.
J.P. Morgan (JPM) casts the widest net, counting roughly \$5tn of global AI investment through 2030. It assumes the revenue lasts in perpetuity and asks for a 10% return, so each dollar invested needs only about 13 cents of revenue a year. Because the base is so large, the result still comes to about \$650bn a year.
By JPM's own conversion, that is the equivalent of every iPhone user paying \$34.72 a month. In June, JPM raised the figure to about \$700bn. I quoted this number in an article last November, where the text dropped a zero and printed \$65bn. Let me correct that here.
The second choice is how high a return to demand. For the same GS cohort of capex, asking for no return gives \$308bn; doubling the requirement to 30% gives \$636bn.
Bernstein asks the most: annual net profit equal to 15% of cumulative capex, roughly twice GS's bar. It counts only the incremental cloud capex driven by AI, about \$1.17tn cumulatively through 2026. But each of those dollars has to bring back about 63 cents a year, which is how its 2027 hurdle reaches \$729bn.
GMF Research comes at it through valuation. At an 8.5% discount rate, bringing the net present value of roughly \$2tn of 2023–2027 investment to exactly zero requires annual revenue of about 0.61% of global GDP, or about \$730bn.
The third choice is the layer at which revenue is measured. AI revenue comes in three layers: clouds rent out compute, model companies sell models, and application companies turn models into products for end users. GS and Bernstein measure the cloud layer; JPM and GMF combine the clouds with the model companies.
Every additional layer that is also expected to make money pushes the hurdle up another notch. If application-layer companies are to earn a 30% margin as well, GS calculates that application-layer revenue would need to reach \$925bn to \$1.3tn.
Every hurdle is the same multiplication: capex counted × revenue each dollar of capex must bring back per year
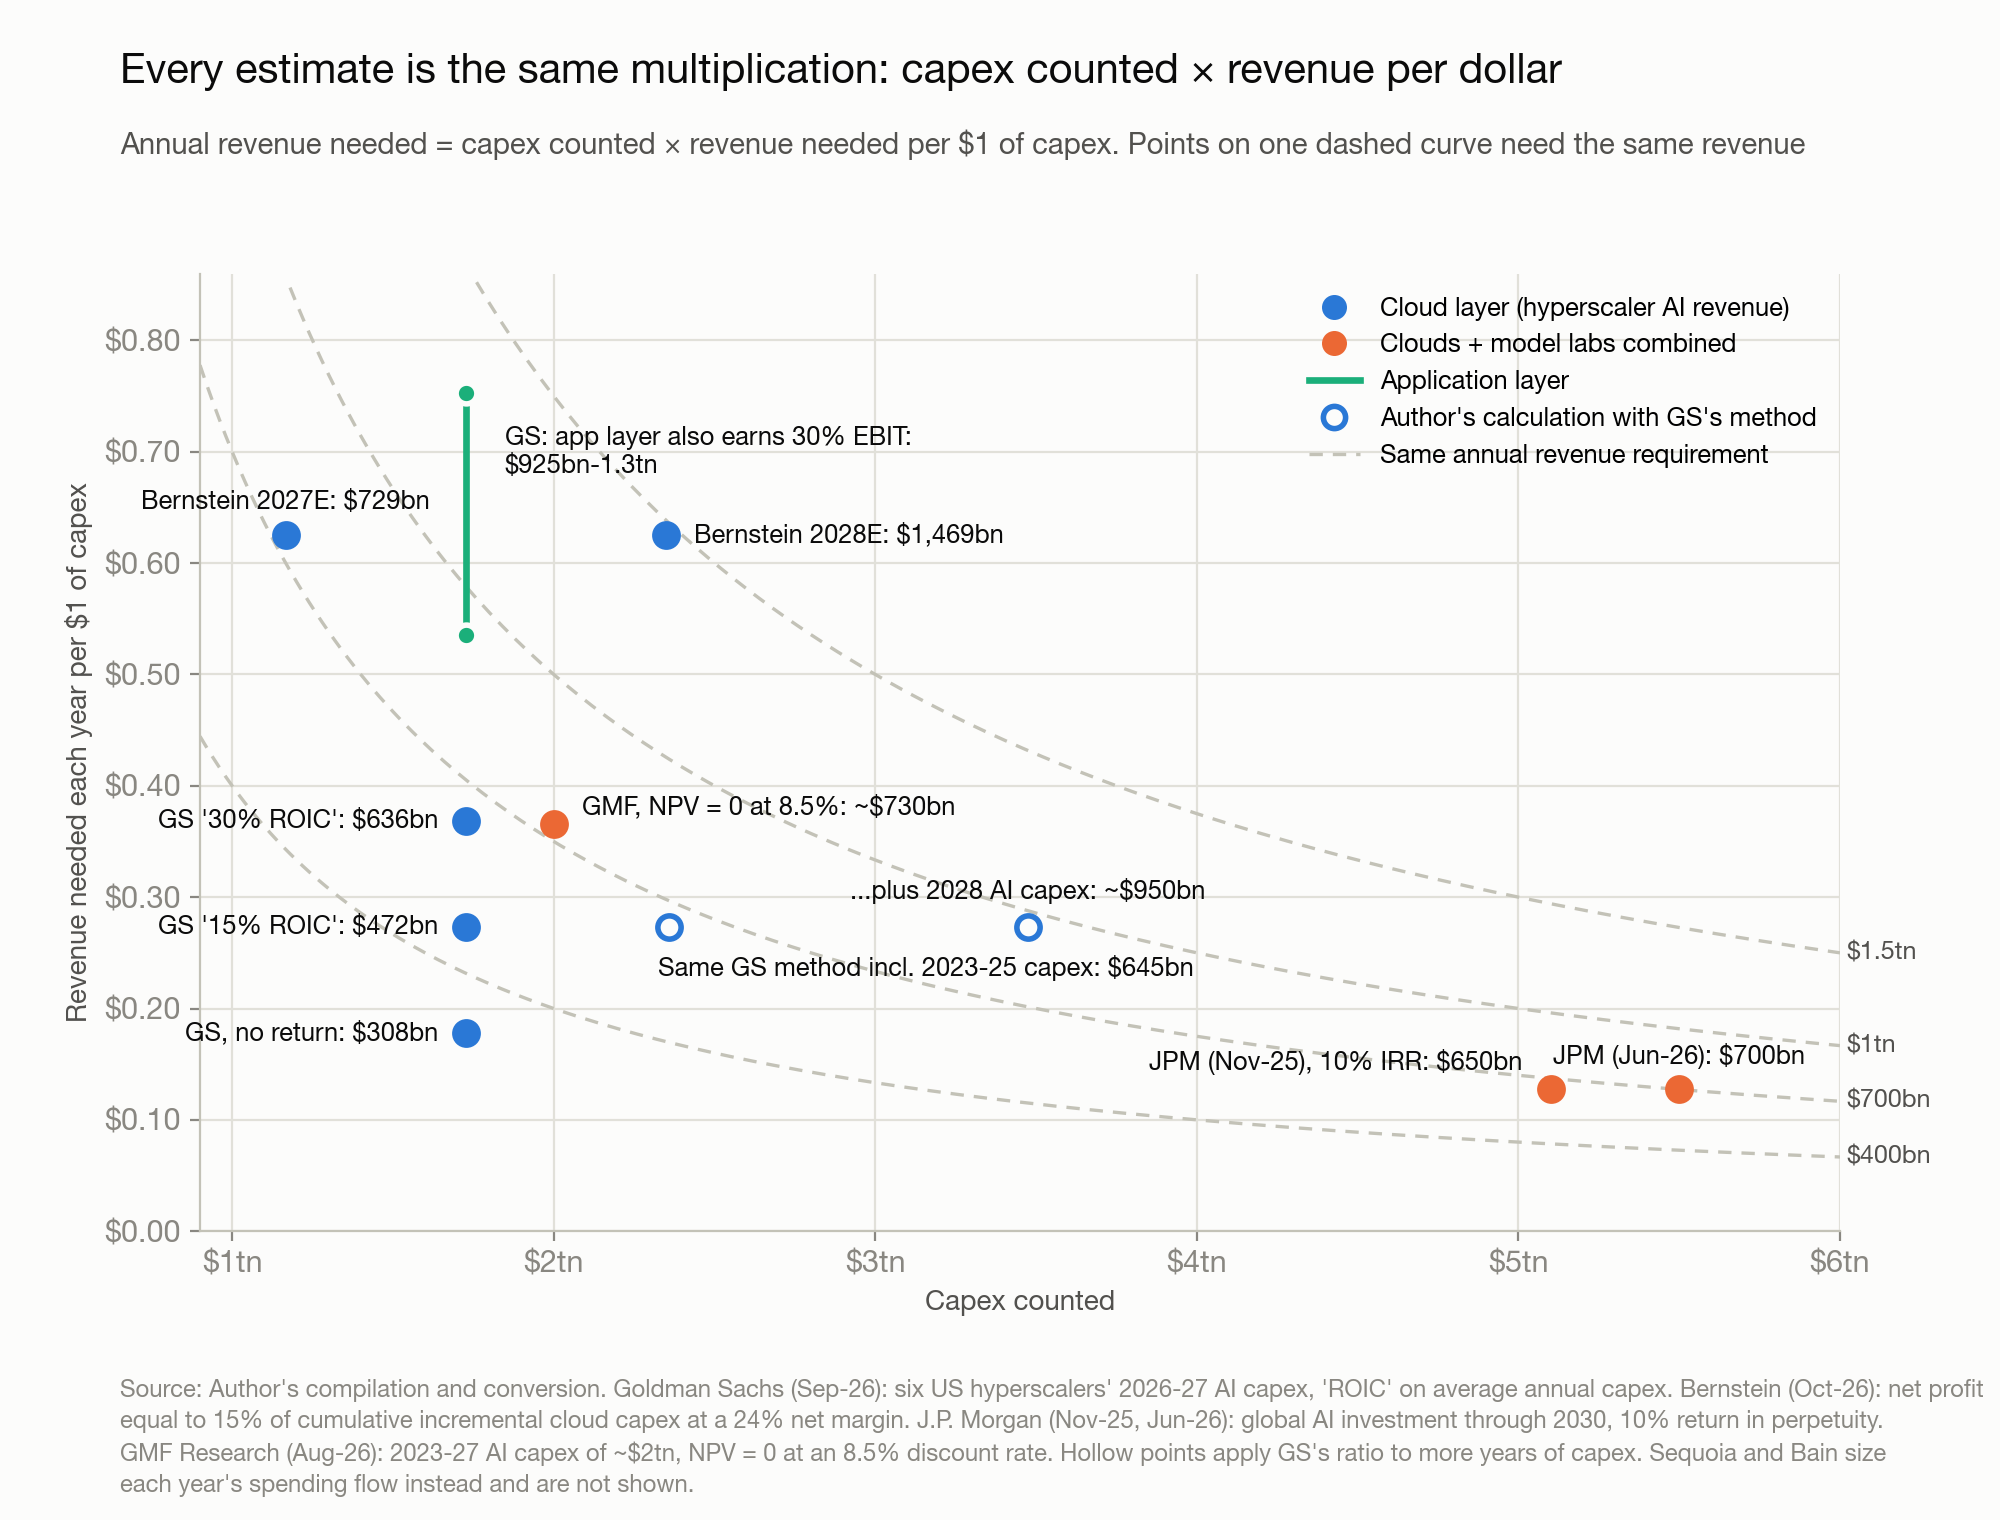
source: Author's compilation and conversion. The vertical axis is each hurdle divided by the capex it counts; points on the same dashed curve need the same revenue each year. Data from Goldman Sachs (2026-09), Bernstein (2026-10), J.P. Morgan (2025-11, 2026-06) and GMF Research (2026-08). Hollow points apply GS's ratio to more years of capex. Sequoia and Bain size each year's spending flow, which answers a different question, so they are not shown.
The headline numbers sit close together partly because two of these choices offset each other. JPM pairs a large base with a low ratio, Bernstein a small base with a high one, and both end up at \$650bn–\$730bn. Recompute all four with a common requirement of 8%–10% a year on total investment and the hurdles spread out to \$390bn–\$870bn; whichever method you pick, the floor is about \$400bn a year.
Sorted by how much capex they count, the estimates fall into three tiers. Counting only the 2026–2027 cohort gives about \$400bn–\$500bn a year. Counting everything invested since 2023 gives about \$600bn–\$750bn, which is where JPM, Bernstein and GMF all land. Add 2028 capex, or require every layer to turn a profit, and the figure tops \$1tn.
Today's revenue, and a hurdle that keeps rising
Now for where revenue stands today. GS compares the revenue of four clouds (AWS, Microsoft, Google Cloud and Oracle) with their pre-AI growth trend; the excess can be read, roughly, as revenue that AI has brought in. In the second quarter it came to only \$67bn annualized, about a seventh of \$472bn.
The hurdle itself rises every year. Consensus capex for 2028 is \$1,281bn, higher than 2027. Fold it in and the same method's hurdle rises to about \$950bn; in the same Bernstein table, the 2028 hurdle is \$1,469bn.
In fairness, the returns on the clouds' current investments are high. Morgan Stanley estimates that renting out NVIDIA GB300 servers at \$8.50 an hour and 75% utilization earns an ROIC of about 31%.
But that reading was taken with compute at its tightest and rental prices at their peak. GS's data show the clouds' overall ROIC has fallen from about 40% at the 2019 and 2021 highs to 23%–24% this year. The return on next year's \$1.1tn of capex will depend on prices two or three years from now, and token prices are already falling this year.
Part Two: Who Pays. Half the Bill Lands on Two Companies
Several kinds of customers pay this bill: model companies renting compute from the clouds, enterprises buying the clouds' own AI products, and the clouds themselves, using AI to sharpen their advertising. The largest and most measurable piece is the compute bill paid by OpenAI and Anthropic.
According to The Information, as of the end of March the two labs had signed compute contracts worth about \$1,048bn with four clouds: Microsoft, Oracle, Amazon and Google. That is 49.6% of the four's combined backlog (contracted revenue not yet recognized) of \$2,112bn.
The labs' own commitments are starker still. OpenAI has committed to buy about \$1.4tn of compute, slightly more than 30GW, over roughly eight years, part of it under letters of intent. That averages about \$175bn a year, 3.5 times its current annualized revenue of about \$50bn.
Sam Altman said last year that OpenAI's infrastructure would ultimately have to be paid for by its own revenue. On Anthropic's side, according to the draft prospectus seen by Reuters, its cloud, compute and infrastructure payment obligations over roughly the next decade come to about \$518bn.
On the hardware side, concentration is just as high. As I noted in my NVIDIA second-quarter review, NVIDIA's five largest customers account for 70% of its receivables. About \$50bn of the equity it has invested has gone to frontier model companies, and its largest guarantee covers a data-center campus leased by an OpenAI affiliate.
That is why I treat the two labs' combined annualized revenue as the main gauge for this question. It is the fastest-growing slice of AI revenue, and the one companies most often report to their investors.
One dollar, two layers to feed
Turning the industry hurdle into what the two labs need takes one more step: how much of each dollar they collect goes to compute. On this point, the two companies could hardly be more different.
According to the FT, Anthropic told investors that every \$1 it spent on compute in the third quarter brought in \$1.70 of revenue; in other words, about 59 cents of every revenue dollar went to compute. That figure includes the compute used to train new models. A rough calculation from the 85% adjusted gross margin reported by Bloomberg puts inference, the compute that actually serves customers, at only about 15 cents.
In 2025, the same ratio was 159%. According to the prospectus seen by Reuters, Anthropic's revenue that year was about \$4.6bn, its compute and infrastructure spending \$7.33bn, and its operating loss \$8.06bn. By the third quarter, after compute, staff, sales and other costs, it was left with an adjusted operating margin of about 11%, a measure that excludes stock-based compensation.
OpenAI is still using financing to pay for its compute. According to the audited financials published by Ed Zitron (who says the FT verified them), OpenAI's 2025 revenue was \$13.07bn and its operating loss, including stock-based compensation, was \$20.92bn. Excluding stock-based compensation, its operating margin in the first quarter of this year was still −122%, and under the company's February plan, this year's compute spending comes to about 1.5 times revenue.
Taken together, the two labs will spend roughly 90% of their revenue on compute this year, down from more than 130% in 2025. The gap is filled mostly by OpenAI's investors: the company burned about \$8bn of cash in 2025 and plans to burn \$25bn this year.
The two labs' unit economics: Anthropic's compute spending has fallen to 59% of revenue, OpenAI's is still above 100%
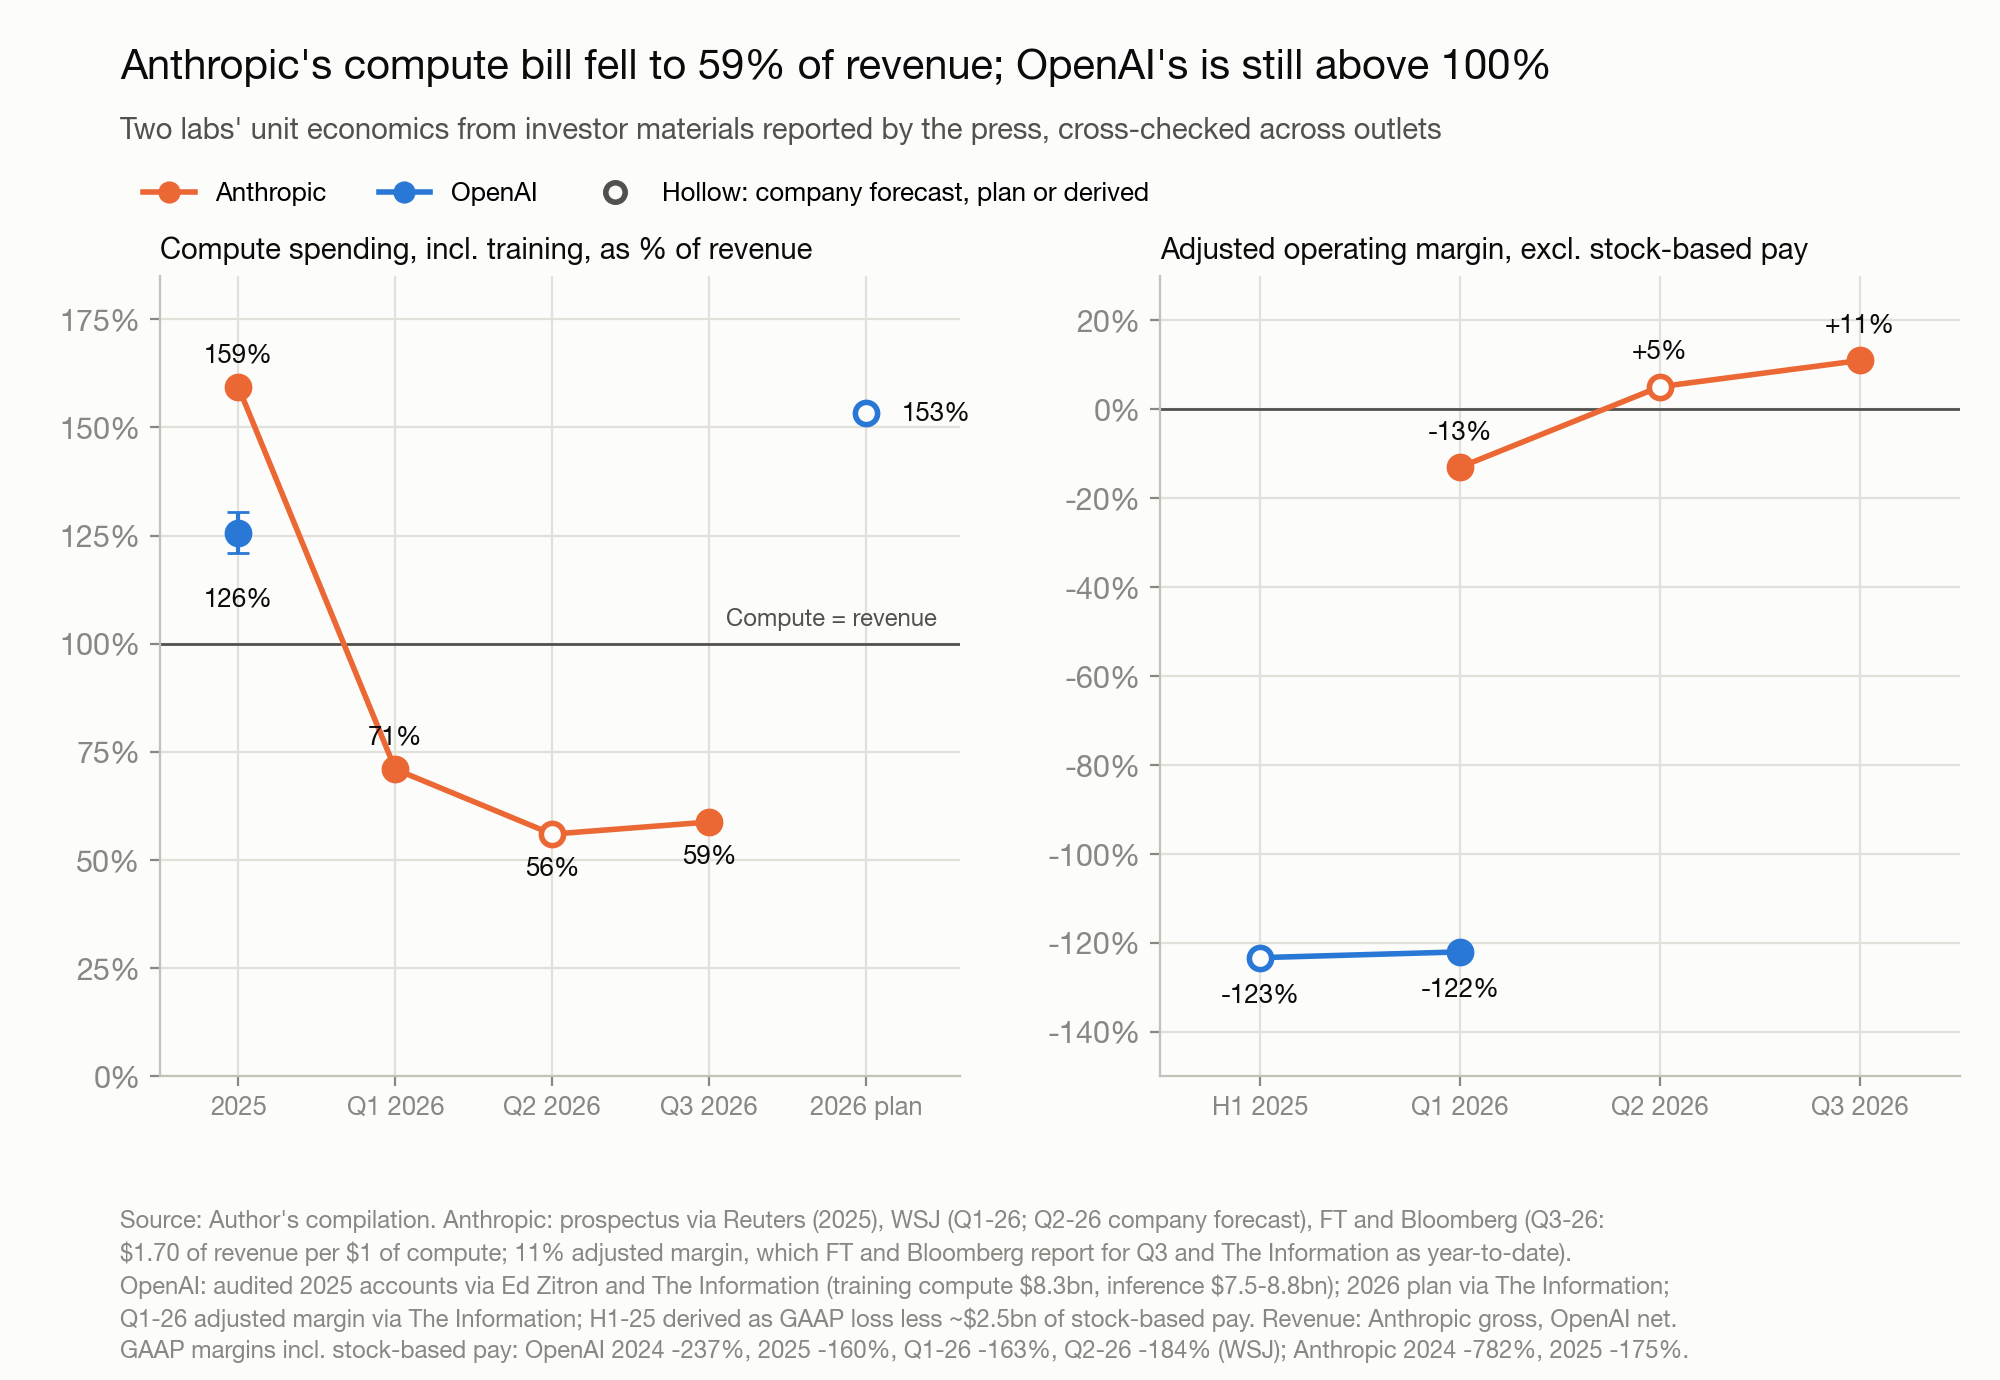
source: Author's compilation, cross-checked. Anthropic data from the prospectus as reported by Reuters (2025), WSJ (Q1 2026 actual and the company's Q2 forecast), and FT and Bloomberg (Q3). Q3 revenue of \$16.8bn was obtained independently from attendees by the FT, Bloomberg, Reuters and The Information. The 11% adjusted operating margin is placed in Q3 by the FT and Bloomberg and described as year-to-date by The Information. OpenAI data from the audited financials published by Ed Zitron and from The Information; 2025 training compute was \$8.3bn. Hollow markers are company forecasts, plans or derived values.
These figures come from investor materials cited by the press and from leaked statements; neither company has disclosed them publicly. I checked each number against other outlets' reporting, or against figures from which it can be derived. Points on different bases are marked separately in the chart, and margins that include stock-based compensation appear only in the notes.
Bernstein's \$729bn assumes the model companies earn nothing and pass every dollar of revenue on to the clouds. Yet Anthropic is valued at about \$965bn and preparing to list in November, a valuation that presumes it will make money one day. The higher the model companies' margins, the more customers must pay them to fill the same cloud hurdle.
So the conversion rests on three assumptions: the hurdle takes the three tiers above; the two labs carry about half of it, based on their share of the four clouds' backlog; and both keep Anthropic's current cost structure. The two labs' combined annualized revenue requirement is then half the industry hurdle divided by 59%, or 0.85 times the hurdle.
Table: From industry hurdle to what the two labs need. Hurdles follow GS's method: the low tier counts only 2026–2027 capex, the middle tier adds 2023–2025, and the high tier also adds 2028 AI capex. The two labs carry half (49.6% of the four clouds' backlog comes from them), and 59 cents of every revenue dollar goes to compute (Anthropic, Q3). Monthly growth is measured from \$124bn at the end of September 2026.
Which assumption the table leans on most
The table is most sensitive to the second assumption. Cut the two labs' share to a quarter and the middle tier needs only about \$274bn, within reach at 5.4% monthly growth; raise it to three quarters and the requirement becomes about \$822bn. Extrapolate the third quarter's dollar additions in a straight line, and the math only works if demand outside the two labs carries more than 70% of the bill.
I use half because of the backlog: the clouds build data centers against signed contracts, and half of those contracts come from these two labs. Today's revenue points the same way. At 59% of roughly \$124bn of annualized revenue, the two labs pay about \$73bn a year for compute, close to the \$67bn of above-trend cloud revenue that GS estimates.
The two figures differ in timing and scope, and some of the labs' compute spending goes to companies outside the four clouds, so this is only a rough comparison. What it suggests is that most of the incremental AI cloud revenue visible today may come from these two companies.
The pushback comes from Jensen Huang. On the BG2 Pod podcast recently, he argued that the market is putting too much weight on the two labs: frontier labs account for only 25%–30% of NVIDIA's business, and there are five or six of them.
That ratio measures NVIDIA's shipment mix. It includes Meta's and Google's in-house model teams, along with sovereign AI and neoclouds, buyers that sit outside the hyperscalers' books. Where NVIDIA's chips ship and where the clouds' revenue will come from over the next few years are two different questions.
The cost-structure assumption also faces two corrections that pull in opposite directions. Counting the revenue share Anthropic pays the clouds on marketplace sales, the two labs would need somewhat less revenue. On the other hand, the compute they buy from neoclouds such as CoreWeave never reaches the hyperscalers' books, which would raise the requirement.
Over the longer run, the correction points up. Once training takes a smaller share of revenue, the compute cost of each revenue dollar will drift toward the inference level, and the same cloud hurdle will require more revenue.
If the two labs spent about 90% of their revenue on compute, close to their combined level this year, the middle-tier hurdle would fall to about \$360bn. The price is that both companies would never make money, and some link in the chain would always go without a return.
GS offers a more optimistic reading of its own: the revenue the three largest clouds need in 2028–2030 is only about 60% of their backlog. But about half of that backlog comes from the two labs, so whether those orders turn into revenue still comes down to the labs' revenue curve.
Part Three: Revenue Is Slowing. Combined Monthly Growth Fell from About 19% to About 13%
Start with the totals. At the end of 2025, the two labs' combined annualized revenue was about \$30bn; by the end of September 2026 it was about \$124bn, with Anthropic at about \$74bn and OpenAI at about \$50bn.
The two report on different bases. OpenAI reports net of partner revenue shares, while Anthropic reports gross, booking in full what it sells through the AWS and Google cloud marketplaces. The basis changes the level, not the direction: restate OpenAI on a gross basis and combined monthly growth falls from about 16% in the first half to about 13% in September, a gentler slowdown.
The market is touchy about this number. On October 8, the FT reported that OpenAI's annualized revenue was close to \$50bn, below the \$70bn previously reported by several outlets, the FT among them. The Nasdaq-100 fell 1.4% that day and Oracle 5.5%.
In dollar terms, the amount added to annualized revenue each month is still rising: about \$9bn a month on average in the first half, about \$13bn in the third quarter.
The growth rate, though, is falling. Combined monthly growth ran at about 25% in February–March, about 19% on average in the first half, about 13% in the third quarter and about 12% in September. Quarterly revenue tells the same story: combined sequential growth fell from 75% in the second quarter to 45% in the third (OpenAI's third quarter is my estimate).
The monthly figures are interpolated between the points the companies have disclosed, and Anthropic's September figure is a third-party estimate. They are good for reading the trend but carry error month to month, so I also give third-quarter averages below.
To make sure these numbers hold up, I checked the key ones against independent sources. They all line up.
Table: Cross-checking the two labs' annualized revenue. Third-party panel estimates are used only as checks; every monthly figure in the text comes from public data points.
The two labs' combined annualized revenue: more dollars added each month, a falling monthly growth rate
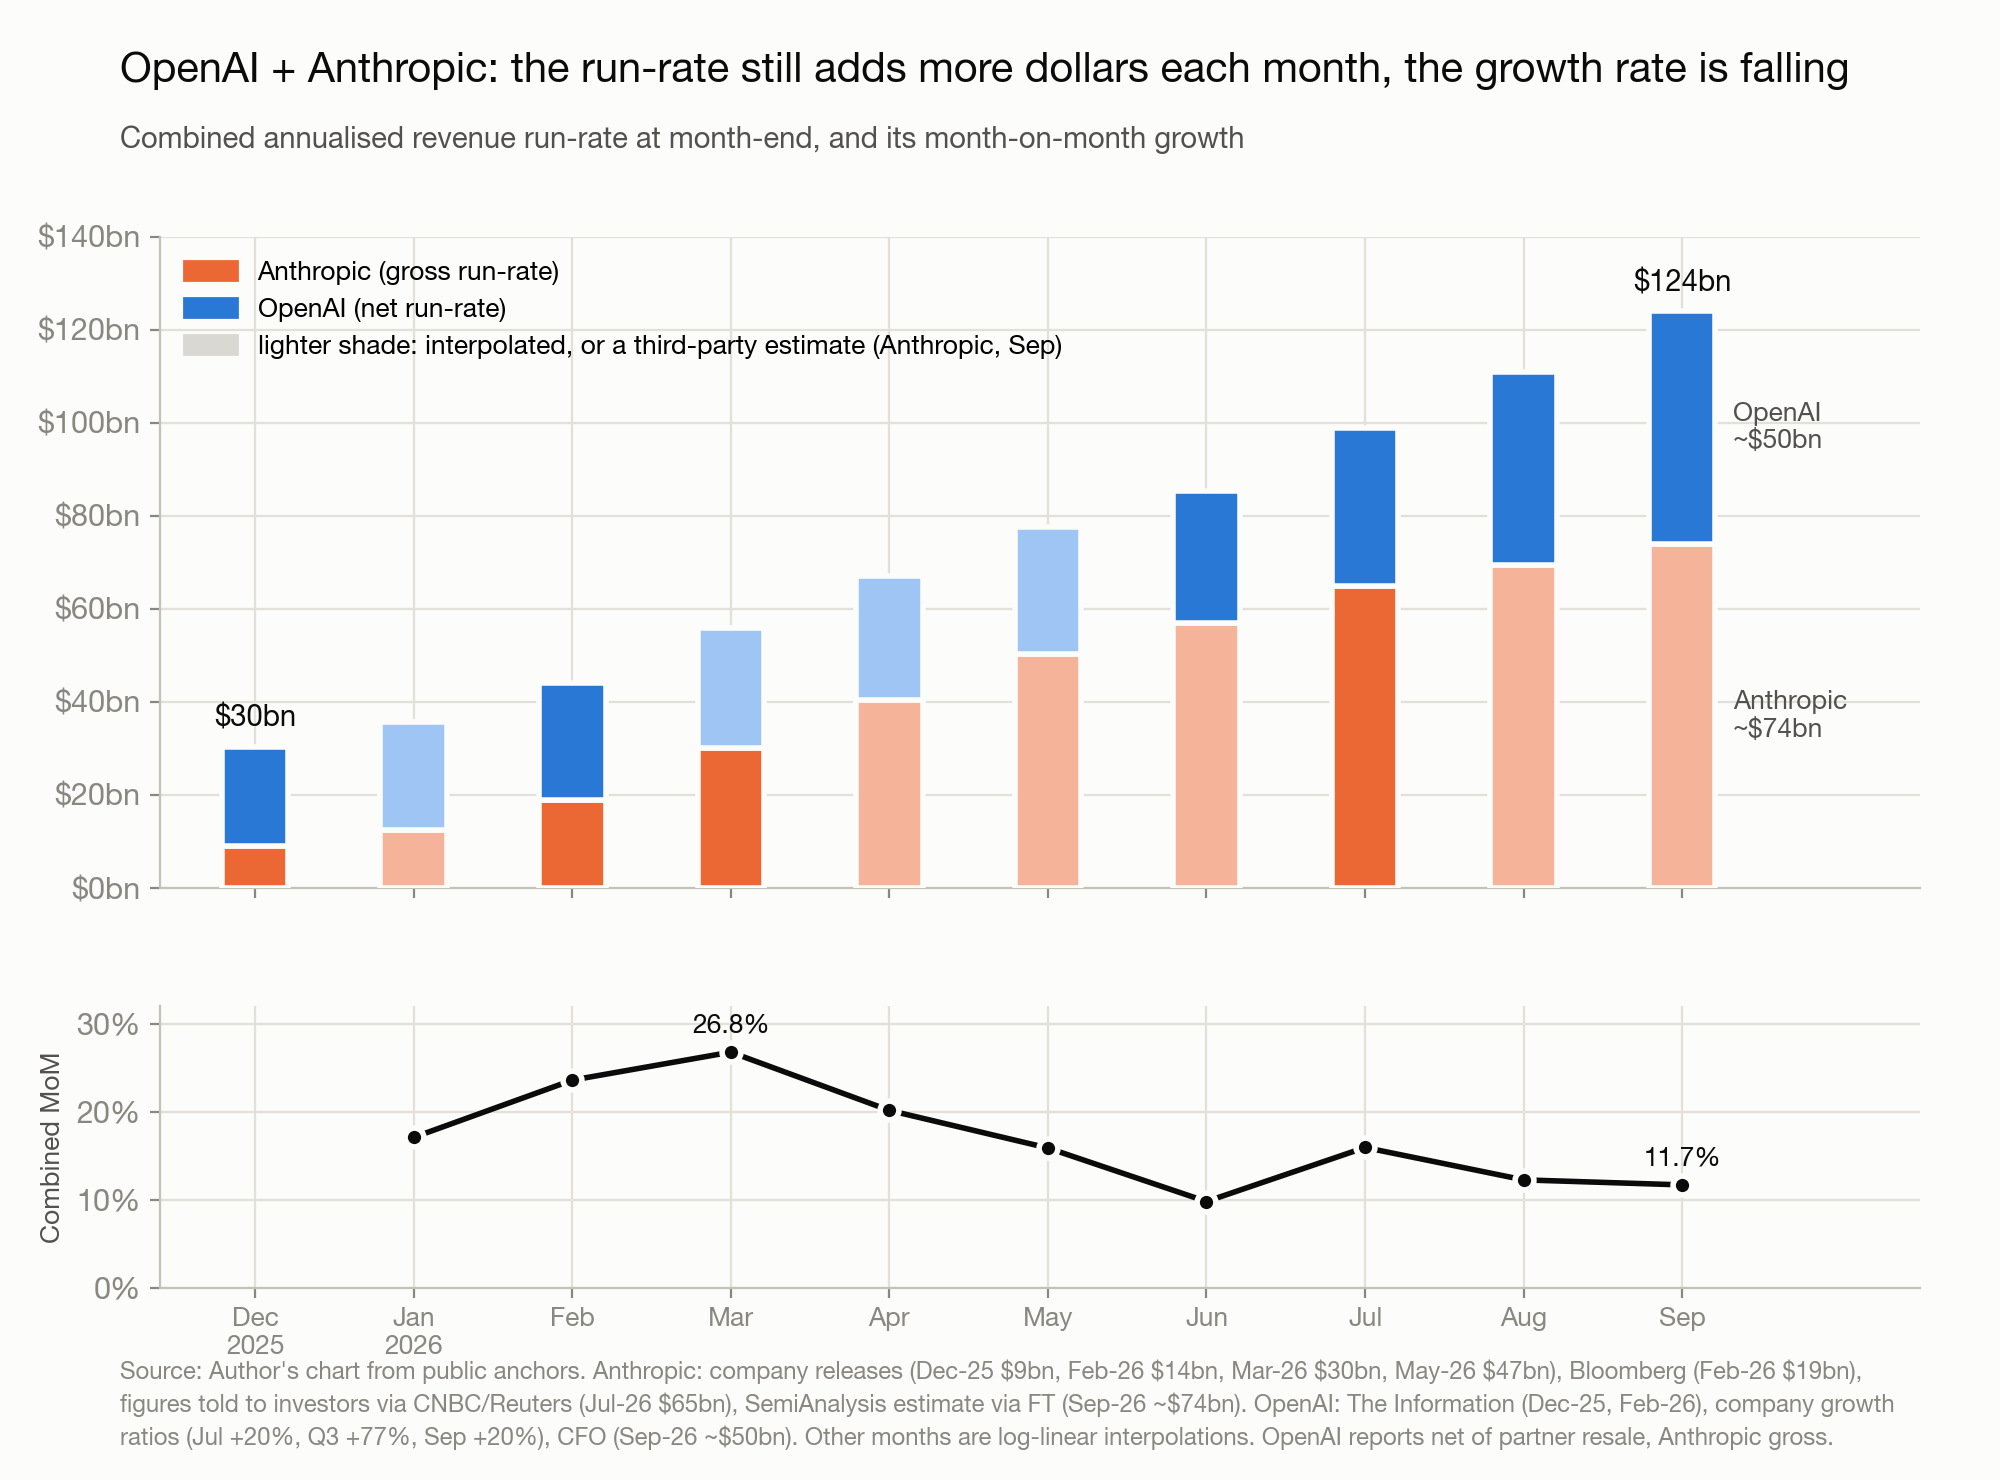
source: Author's compilation from public data points only. Anthropic: company announcements (\$9bn at end-2025; \$14bn in February, \$30bn in March and \$47bn in May 2026) and Bloomberg (\$19bn at end-February). The \$65bn at end-July comes from investor materials reported by CNBC and Reuters; the roughly \$74bn at end-September is SemiAnalysis's estimate via the FT. OpenAI: The Information (end-2025, February 2026), growth rates disclosed by the company (+20% in July, +77% in Q3, +20% in September) and the roughly \$50bn at end-September disclosed by its CFO. Other months are log-linear interpolations.
Pull the two apart and they move in opposite directions. Anthropic's monthly growth fell from about 56% in February–March to about 7% in August–September. The monthly addition to its annualized revenue shrank from about \$11bn at the March peak to less than \$5bn.
OpenAI grew slowly in the first half, about 32% over six months, or less than 5% a month. After GPT-5.6 launched in July, its annualized revenue grew 77% in the third quarter, with the enterprise piece more than doubling.
So part of Anthropic's slowdown is customers moving over to OpenAI, and in the combined total that shift cancels out. SemiAnalysis analyst Joey Brookhart told the FT that the first half belonged to Anthropic alone and that it has since become a two-horse race. Measured by annualized revenue, OpenAI accounted for more than half of the two labs' third-quarter additions. That came from a rebound driven by a single new model, and how long it lasts remains to be seen.
Why growth slowed: usage growth cooled, while prices kept falling
Most of Anthropic's revenue comes from its API, and that revenue can be split in two: how many tokens get used, and what each token sells for. Third-party payment-panel estimates show that unit prices fell all year. What changed in the third quarter was the growth in usage.
In the first quarter, token usage on Anthropic's API grew about 60% a month while the unit price fell about 8% a month, so price cuts absorbed only about a fifth of the growth. In the second quarter, users flocked to the pricier Opus models and the unit price barely moved. In the third quarter, monthly usage growth dropped to about 20% while the unit price went back to falling about 8% a month; price cuts ate about half of the growth, and in August nearly all of it.
Anthropic's API: usage growth slowed while unit prices kept falling; on the developer platform, users moved to cheaper models
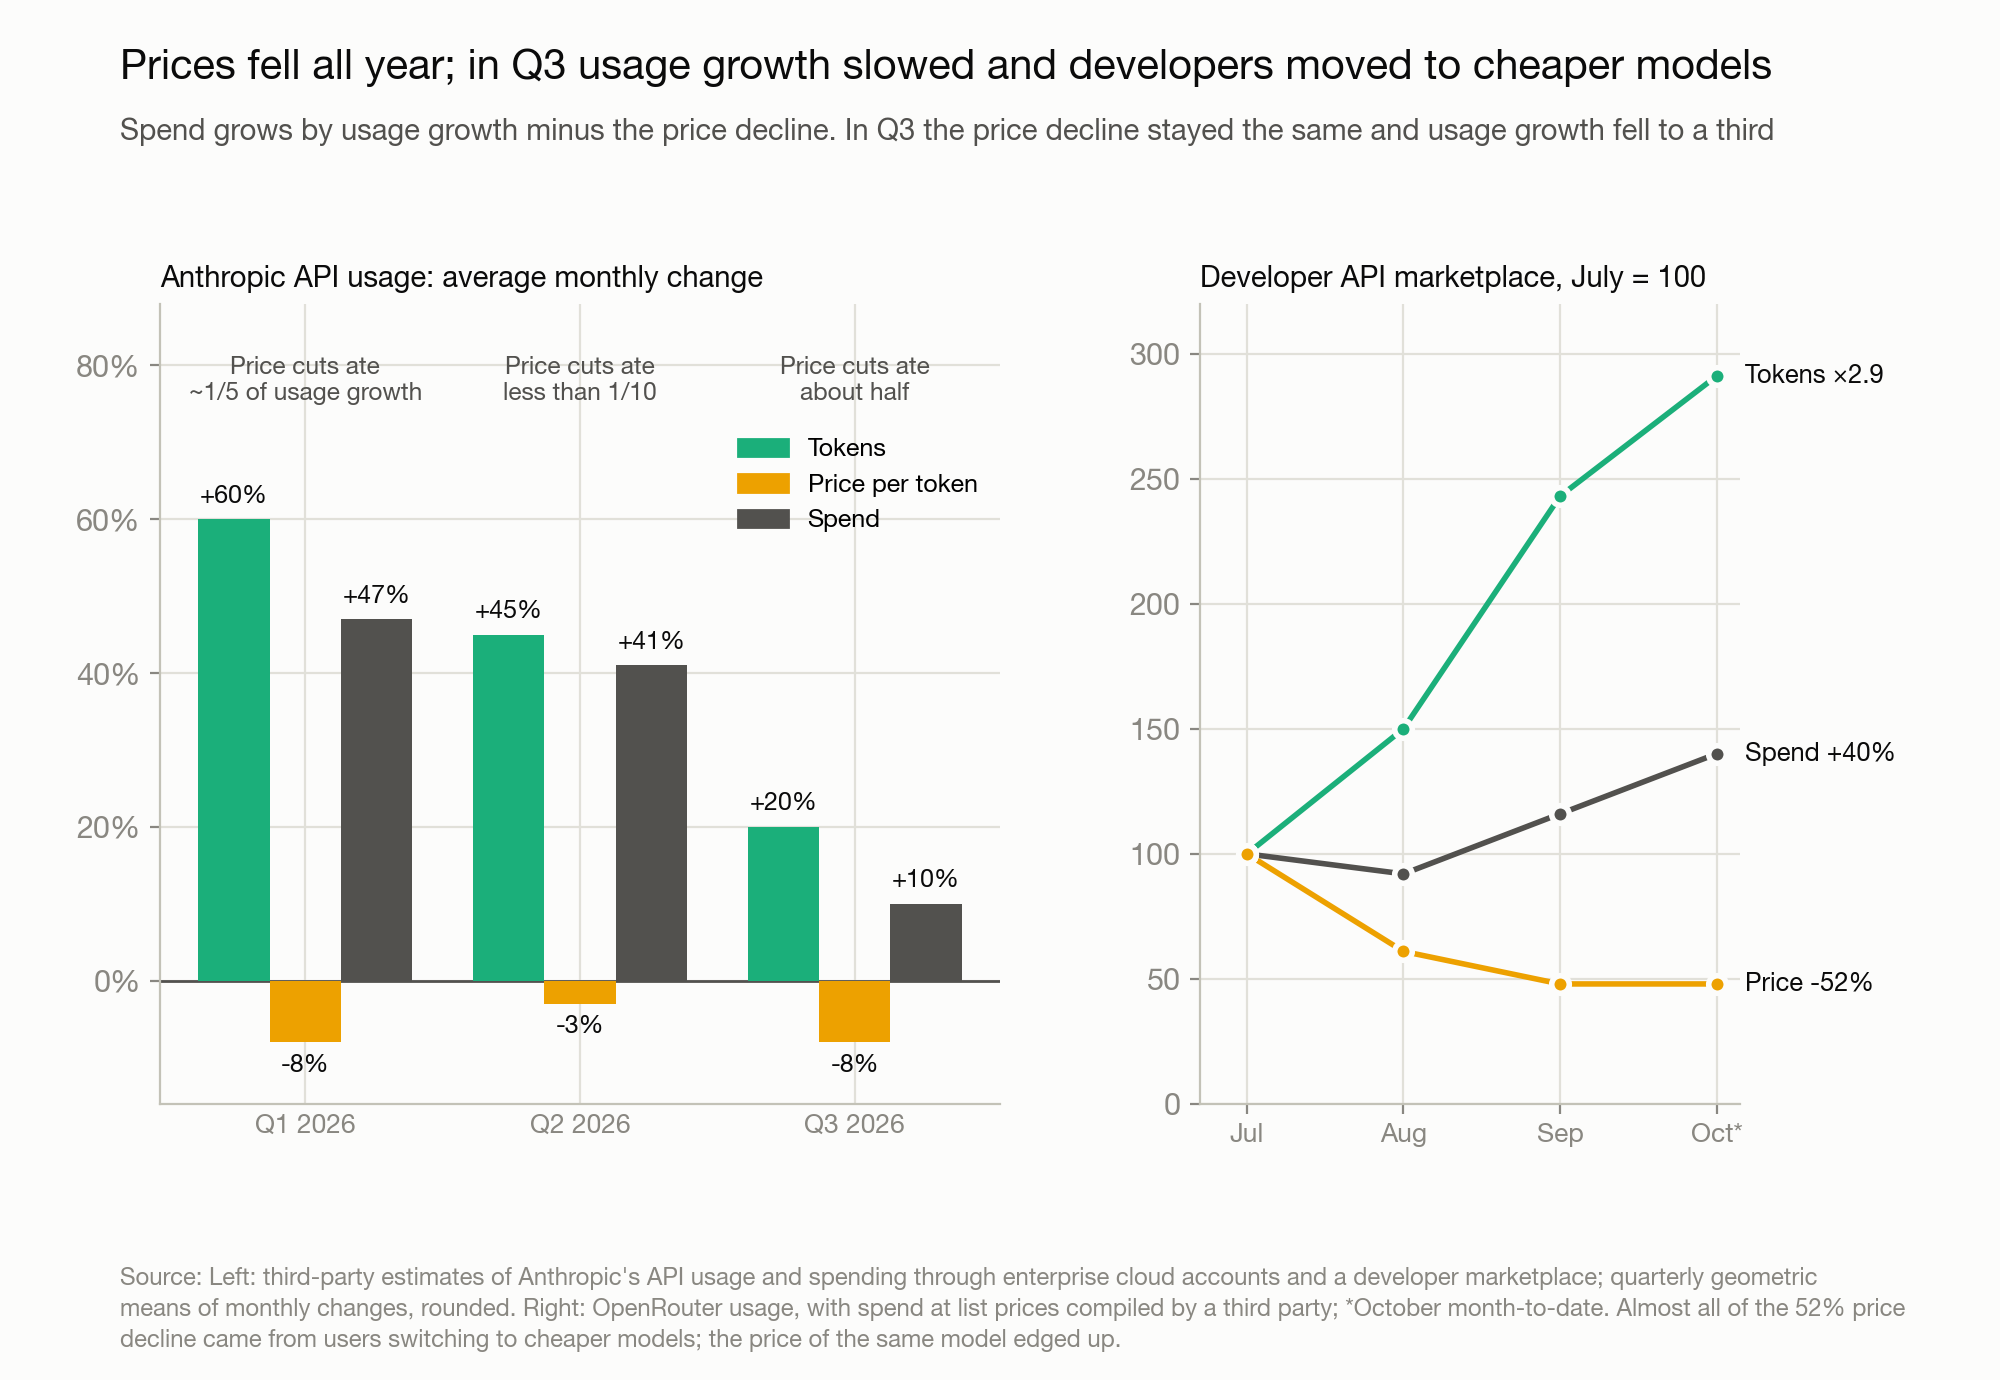
source: Left: third-party estimates of Anthropic's API usage and spending, covering enterprise cloud accounts and the developer platform; geometric means of monthly changes by quarter, rounded. Right: paid token usage on OpenRouter, with spending at list prices, compiled by a third party; October is month-to-date.
The falling unit price comes mainly from model switching. Each new generation is cheaper per token, so every time users upgrade, revenue gets repriced. Claude Opus 5.5, which Anthropic released in late September, costs 40% less than its predecessor on typical workloads, according to the company's own tests.
The effect is clearest on developer platforms, where switching costs are lowest. Public data from OpenRouter, a model-routing platform, show total token volume growing about 52% in both August and September. Measured by paid tokens, usage nearly tripled from July to October, while spending rose only about 40% and the unit price roughly halved.
All of that price decline came from switching models; the price of any given model actually edged up. Chinese models took about 70% of the platform's tokens but only about 30% of its spending. By my estimate, the platform accounts for only around 1% of the two labs' tokens, but it is the best window into how price-sensitive developers choose their models.
For Anthropic, other providers' low prices show up as lost volume. Claude's share of spending on the platform fell from nearly 60% at mid-year to about 30%. On the third-party panel's breakdown, the slowdown in Anthropic's new revenue in the third quarter came mainly from the developer channel swinging from growth to decline.
The enterprise cloud channel looks different. Third-party billing samples show large enterprises still using more Claude through the clouds, but growth in that usage halved after August. The unit price kept falling by about a tenth every four weeks. Large enterprises need testing and approvals before they switch models, and open-source and Chinese models hold only a sliver of share there, so what slowed in this channel was volume.
Spending that fails to keep pace with usage is not just Anthropic's problem. Corporate card spending tracked by Ramp, mostly at small and mid-sized businesses, shows token usage rising in August and September while token spending was nearly flat. Ramp called the slowdown "unusually stubborn."
The Wall Street Journal reported in August that OpenAI had cut prices on its two newest models. The reason given was that enterprise customers had grown more cautious about AI spending and were shifting more tasks to cheaper Chinese models.
There is a technical reason behind the falling prices. In my piece on DeepSeek-V4.1-Flash, I worked out that on the same GB200 rack, two generations of models raised theoretical throughput at 128K context by 90 times. The model's official price is still 60 to 120 times its hardware cost.
Every step down in cost opens room to cut prices, and competition will force that room open. The return capex needs is counted in dollars. However fast token usage grows, if unit prices fall just as fast, the dollars don't grow.
Of the four reasons for the slowdown the FT listed, competition and the price war have been covered above. The other two, distillation revenue and big customers building their own tools, are invisible to the third-party panels.
Distillation revenue is what Anthropic earns when rivals call Claude heavily to train their own models. According to the FT, it makes up 5%–7% of Anthropic's revenue, and the company deliberately cut it back hard in the third quarter. By my calculation, of the drop in Anthropic's sequential growth from over 140% to 45%, distillation explains at most 11 percentage points.
According to The Information, Microsoft cut its expected spending this year on employees' internal use of Claude by more than a third. Customer spending on Claude through Microsoft's products is rising, however, so the two roughly offset and Microsoft's total payments to Anthropic are about flat. The change at Meta is more direct: the number of employees using the coding tool Claude Code internally fell from about 60,000 to about 30,000.
Consumers are a secondary drag pointing the same way. A sample of US consumer subscriptions shows that for every 10 new Claude subscriptions, about 6 were cancelled over the same period, up from about 3 at the start of the year. SemiAnalysis estimates that subscriptions make up only about a tenth of Anthropic's revenue.
Businesses are tightening their budgets too. A sample of payments by small and mid-sized businesses shows net new AI spending in August about 20% below July, with fewer and fewer new customers arriving. KPMG's third-quarter survey of large US companies found that 74% have built cost reviews into AI project approvals and 43% have set usage or token budgets.
The third-quarter slowdown came from demand and pricing
The strongest objection to this conclusion is that revenue slowed because compute ran short. NVIDIA's CFO has said the labs' growth is "limited by compute," and all three major clouds say demand outstrips available capacity. In the first half, that constraint was real: in April, Anthropic publicly acknowledged that rapid growth had hurt the reliability of its service.
From May on, things changed. Anthropic signed for more than 300MW of compute with SpaceX and, the same day, doubled Claude Code's five-hour usage limits and sharply raised API rate limits on its Opus models. The API is billed by usage. If compute were the main constraint on revenue, API revenue should have accelerated once the limits were lifted.
Instead, growth kept sliding in the third quarter. Compute is still tight, but that alone cannot explain the third-quarter slowdown. The evidence so far points to demand and pricing.
Dylan Patel, SemiAnalysis's founder, has floated another possibility: the model companies allocated more of their new compute to research and training and deliberately took on less inference business. Public data cannot test that idea yet. Even if it holds, it means revenue has to wait for the next generation of models, and the bill will not wait.
Line the reasons up side by side and usage and price top the list, while a shortage of compute does not explain the third-quarter slowdown.
Table: Candidate causes of Anthropic's third-quarter slowdown. The first three overlap: users switching to other providers' cheaper models show up in Anthropic's data as slower usage growth. Usage, price and channel data are third-party payment-panel estimates, rounded; the rest comes from the FT, The Information, CNBC, SemiAnalysis and KPMG.
Part Four: The Deceleration Budget. Monthly Growth Can Slow by No More Than 0.2 to 0.5 Points a Month
Set the targets the two labs must hit beside the pace they are running at now. From \$124bn at the end of September, there are 15 months left until the end of 2027. The chart below shows five paths, each standing for a different assumption about the future.
Five paths for the two labs' combined annualized revenue: only the two with no further slowdown clear the middle tier by end-2027
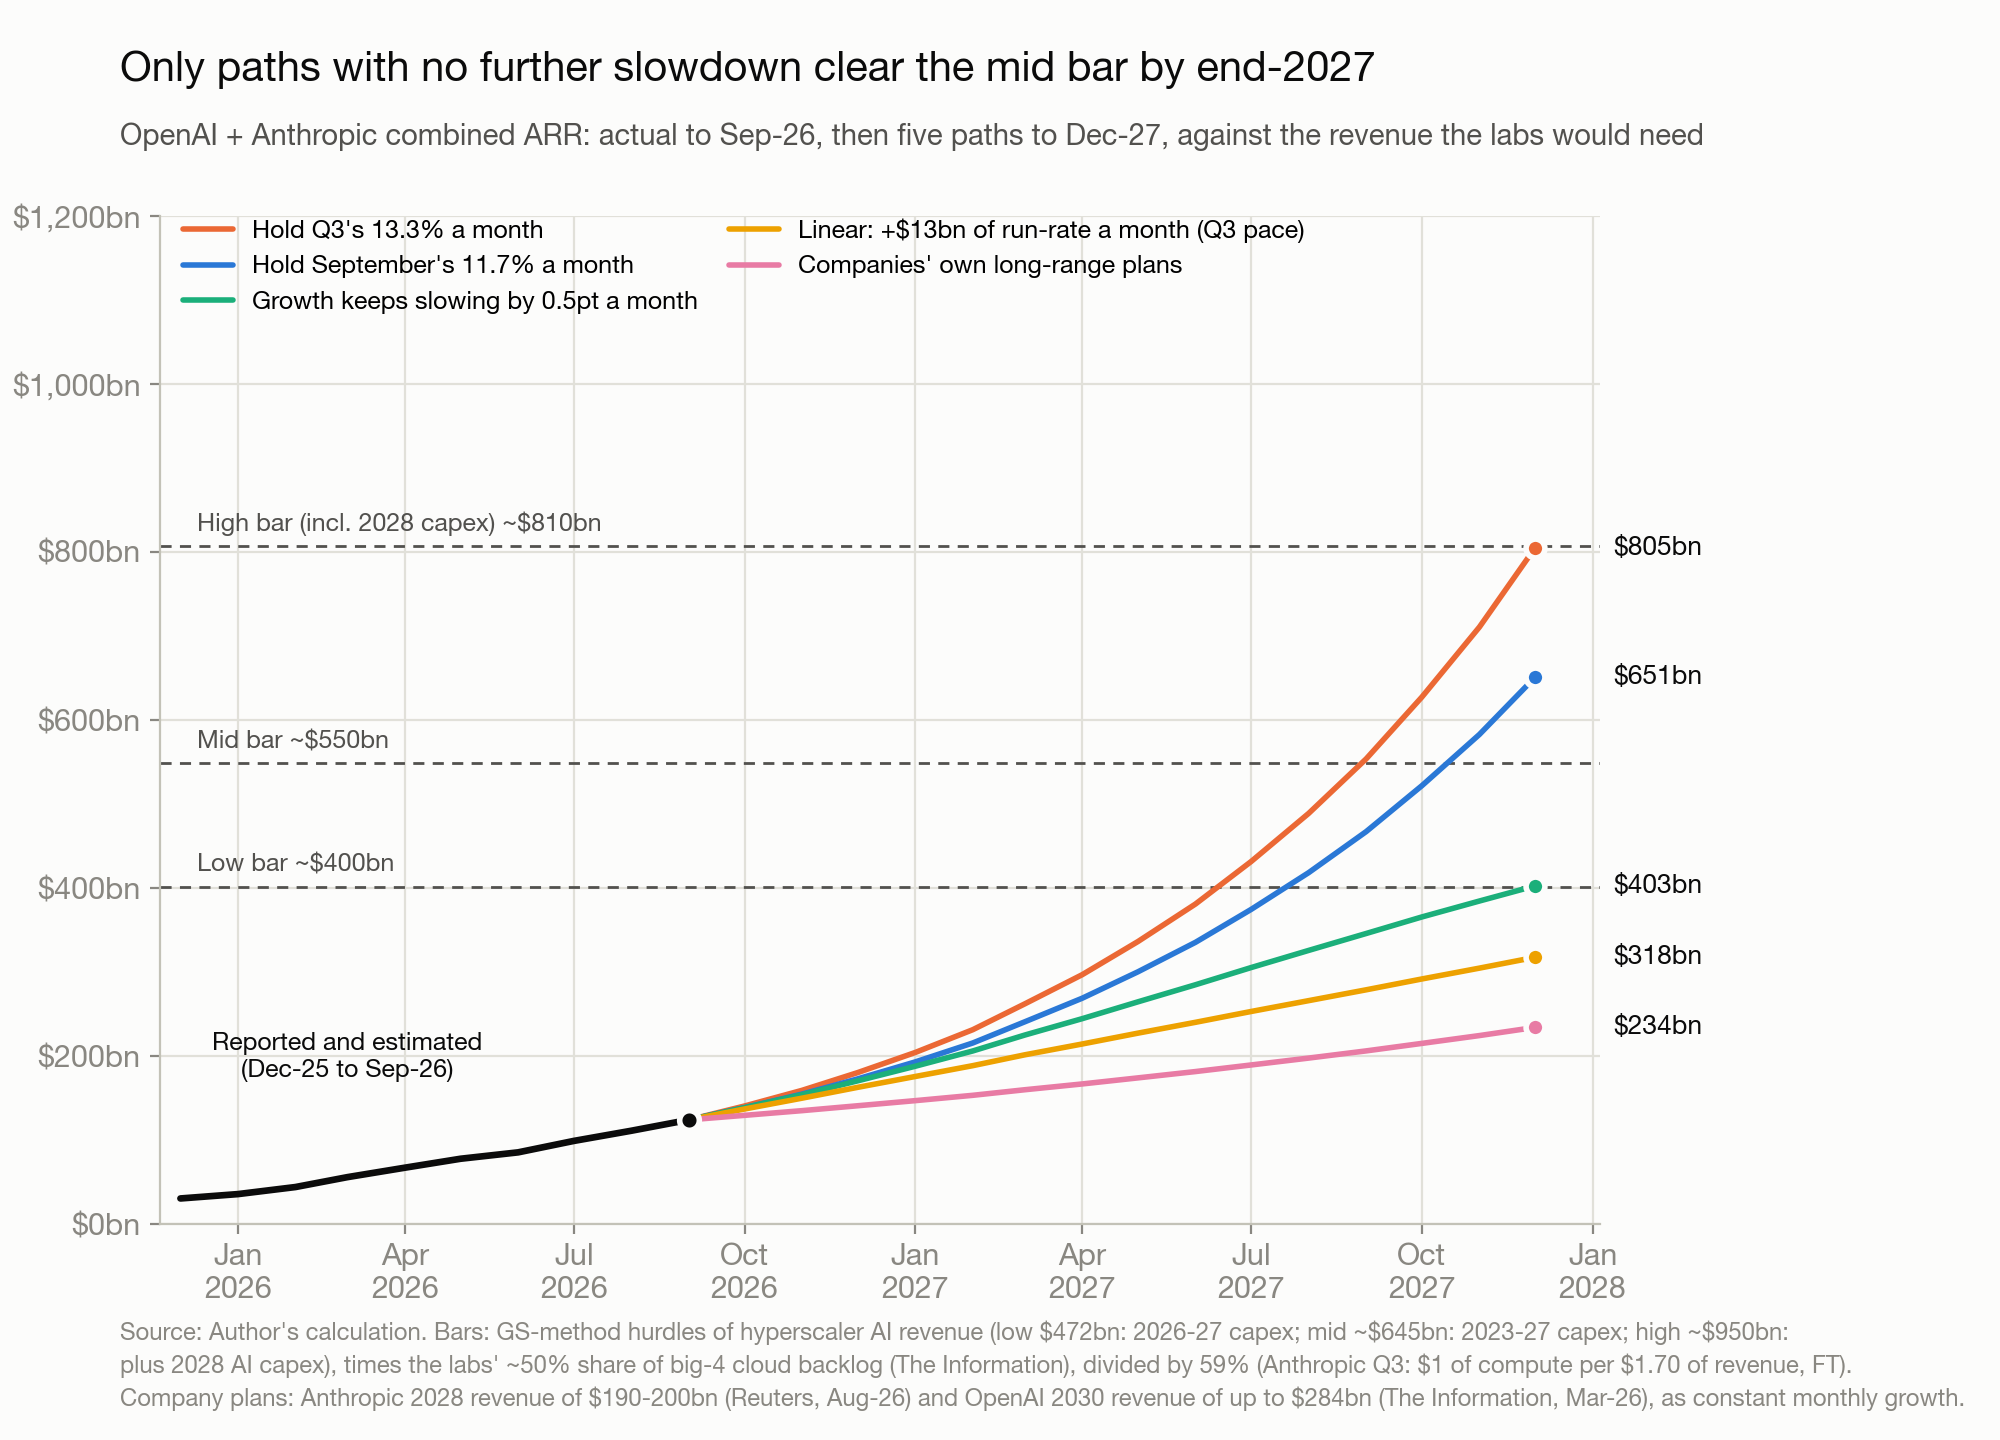
source: Author's calculation. The three targets are converted as in Part Two. Company plans use Anthropic's 2028 revenue forecast to investors of \$190–200bn (Reuters, 2026-08) and OpenAI's 2030 revenue target of up to \$284bn (The Information, 2026-03), both converted to constant monthly growth.
The simplest extrapolation assumes the monthly dollar addition to annualized revenue stays at its third-quarter level of about \$13bn. That line reaches about \$320bn by the end of 2027, short even of the \$400bn low tier.
The companies' own long-range plans for investors are more conservative still. According to Reuters, Anthropic forecasts 2028 revenue of \$190bn–\$200bn, one of the bases for its IPO valuation; OpenAI's 2030 target, set early this year, tops out at \$284bn. Converted to monthly growth, that is only 4%–5%, which gets to about \$235bn by the end of 2027.
Clearing the \$550bn middle tier takes monthly growth of 10.4%, or 3.3 times a year; clearing the high tier takes 13.3%. If September's 11.7% pace held, the total would reach about \$650bn by the end of 2027; holding the third-quarter average of 13.3% would get it to about \$805bn.
Dylan Patel said on a podcast recently that he believes the two labs can reach \$600bn–\$700bn by next December. That corresponds to exactly 11%–12% monthly growth, held constant for 15 months.
So the key variable is how much further growth can slow. I call that margin the deceleration budget: the most that monthly growth can fall, in percentage points per month, without missing the target.
Starting from September's 11.7%, the deceleration budget for clearing the middle tier by the end of 2027 is 0.18 points a month; starting from the third-quarter average of 13.3%, it is 0.41 points. The green line in the chart is growth slowing by 0.5 points a month from September: it reaches about \$403bn by the end of 2027, just enough for the low tier.
Stretch the deadline to mid-2029 and the budget is still only 0.38–0.52 points. That is because 2028 capex lifts the hurdle the two labs have to cover to about \$810bn.
Over the past six months, growth has actually slowed much faster. From the first-half average to the third-quarter average, it fell about 1.2 points a month. From the February–March peak to September, it fell about 2.1 points a month.
Even on the most lenient measure, the actual slowdown is more than twice the budget. On the strictest, it is more than 11 times.
Growth rates falling as the base gets bigger is normal; no high-growth business escapes it. But the size of the bill is fixed the moment the capex decision is made, two or three years before the revenue arrives, and it does not shrink because the revenue base has grown. The base effect makes deceleration inevitable, while the bill demands almost none. That is exactly where the math stops working.
Part Five: Even If Growth Holds, a \$550bn Token Bill Can Only Come Out of Payroll
Take one more step back and assume the two labs do hold monthly growth above 10%. By the end of 2027, customers would then be paying them about \$550bn a year for tokens, about \$420bn more than today. Where that money comes from is the second hurdle.
Start with IT budgets. Gartner forecasts global software spending of \$1,468bn in 2026, so \$550bn would be 37% of it. Gartner's CIO survey shows IT budgets growing an average of just 3.7% in 2027.
On that basis, the total increase in global IT budgets next year comes to about \$236bn, of which software, IT services and cloud infrastructure account for about \$123bn. The new spending the two labs need is 1.8 times the total increase in IT budgets and 3.4 times the increase in software and services.
A CIO survey by Enterprise Technology Research put it bluntly: this is "reallocation, not new money." The other two wallets are not big enough either. Menlo Ventures estimates global consumer spending on AI at about \$40bn in 2026, and enterprise spending on generative AI was \$37bn in 2025.
What the two labs need, next to the wallets their customers could draw on
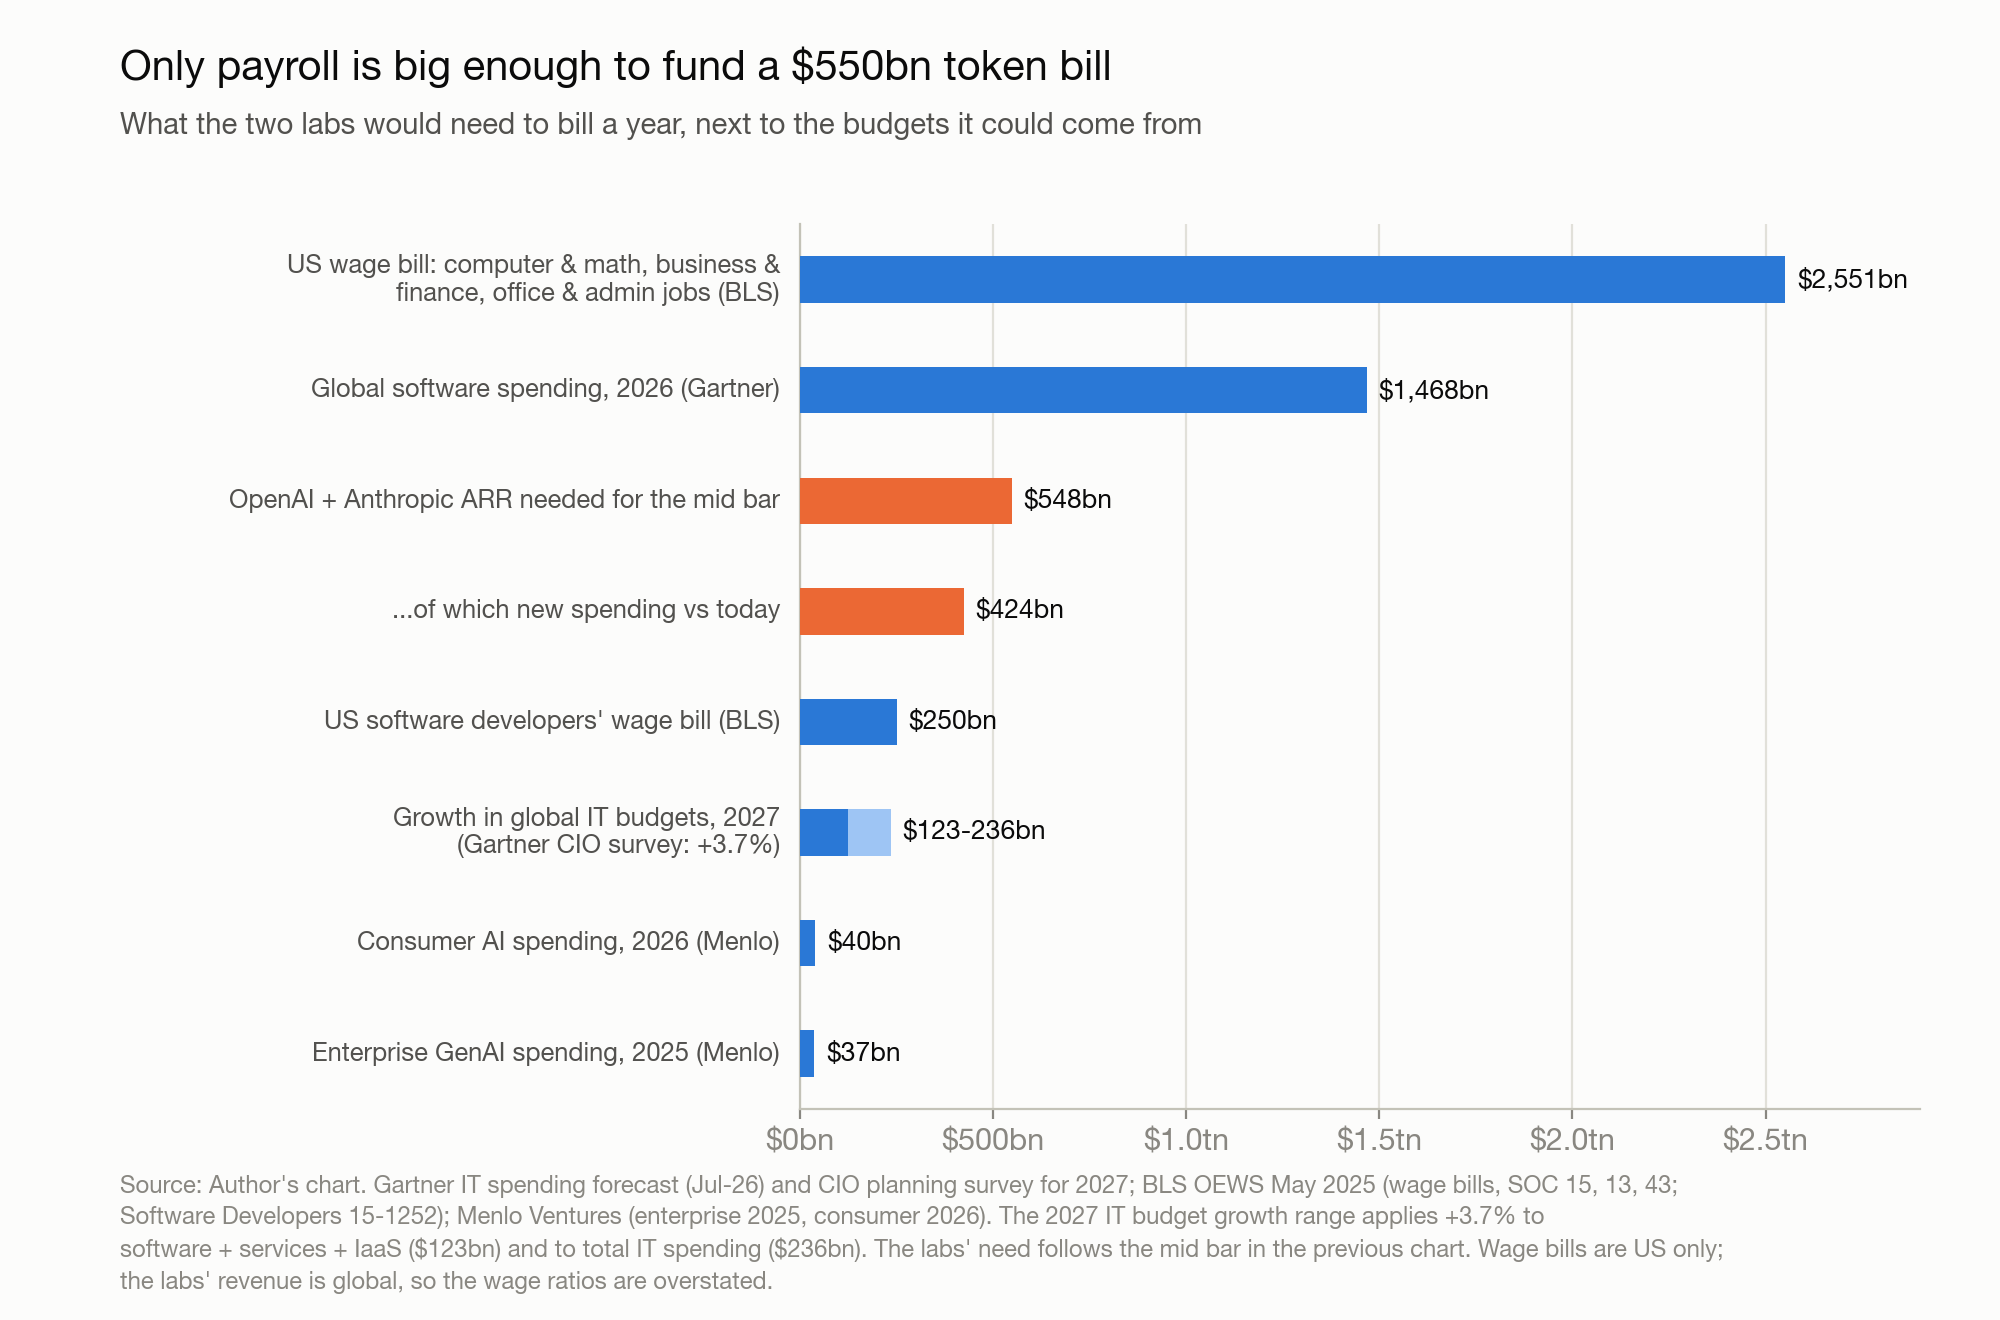
source: Author's compilation. Gartner 2026 IT spending forecast (2026-07) and 2027 CIO planning survey; BLS OEWS wage data, May 2025 (US only); Menlo Ventures.
The only pool of money that compares in scale is white-collar pay. The total wage bill for three large white-collar groups in the US (computer and mathematical, business and financial, and office and administrative occupations) is about \$2,551bn, and \$550bn is about a fifth of it. The labs' revenue comes from all over the world while this compares it only with US wages, so the ratio is overstated, but the order of magnitude holds.
Coding is the largest single use case today. According to the Anthropic Economic Index, using November 2025 data, computer and mathematical tasks make up about half of Anthropic's API traffic. If 40% of the two labs' revenue came from coding, about \$220bn of the \$550bn would have to come from coding, close to 90% of the entire US wage bill for software developers (about \$250bn).
Coding alone cannot carry that number. Uses beyond coding have to become the main consumers of tokens.
Two payrolls
A company's books have to balance too. Paying employees as usual while paying a second payroll for tokens, with results no better than before, is not a state that can last for long. For token budgets to reach \$550bn, either AI replaces some people and the saved wages turn into tokens, or AI brings in new revenue.
Both paths are still narrow. In Gartner's CIO survey, only 13% of respondents say they have gotten "significant value" from AI tools. Broader surveys are more upbeat, with nearly 60% of executives in KPMG's survey saying AI has delivered measurable value. But measurable value and value large enough to justify a second payroll are two different bars.
Evidence of labor substitution exists, but it is concentrated. The Stanford Digital Economy Lab has found that in the occupations most exposed to AI, young workers' employment has fallen behind.
Employment among 22- to 25-year-olds in those occupations is 19% below what the trend for their peers in less exposed occupations would imply. Experienced workers show no comparable gap, and the authors note that the gap narrows once education is controlled for.
The Federal Reserve Bank of New York surveyed service firms in its district. Over the past six months, 4% laid people off because of AI and about 15% hired fewer because of it, while about 13% hired more because of AI. The Yale Budget Lab's October 14 update still finds no clear evidence that AI has disrupted the labor market.
Resistance to substitution is rising as well. In a Pew Research Center survey, 71% of US adults said AI will reduce jobs over the next 20 years; Gallup asked about the next 10 years and got 79%. California signed a law on September 30 requiring layoff notices to state when job losses are caused by AI, flagged as "technology displacement."
Since October 1, Connecticut has required companies to disclose whether AI contributed to mass layoffs. The wages saved through substitution are the only wallet arithmetically big enough, and that path also faces the stiffest political resistance.
The comparison above has one gap: business units' budgets are not counted in IT statistics, so measuring against IT budgets errs on the strict side. But business units' money also has to come out of revenue or be moved out of headcount budgets, so going around the IT budget does not remove the two-payroll constraint. On the consumer side, ChatGPT has 1.2 billion weekly users, and its ad business reached a \$1bn annualized run rate in under 200 days, still a long way from several hundred billion.
Part Six: Three Exits, and the Market Has Started Pricing the Third
The math not adding up shapes where things go over the next few years. Only three exits can change it, and each of them changes the premise of the AI Trade.
The first exit is models climbing another step. As I wrote in my piece on algorithmic progress, AI capability advances more like a staircase: a handful of sudden leaps separated by long plateaus.
An agent is an AI program that can break a task down, call tools and keep working on its own. If the next leap lets agents take on work beyond coding, substitution would spread from young programmers to a much larger white-collar population. The ceiling on the wallet would rise from software developers' wages of about \$250bn to white-collar wages of about \$2,551bn.
The first signs are already here. In enterprise data OpenAI has published for the European Union, agentic work already accounts for 55% of output tokens (the volume of text the model generates) in business accounts. ChatGPT Work, used for work beyond coding, accounts for 21%, and the product only launched in July.
Among EU businesses, agentic work already makes up 55% of output tokens
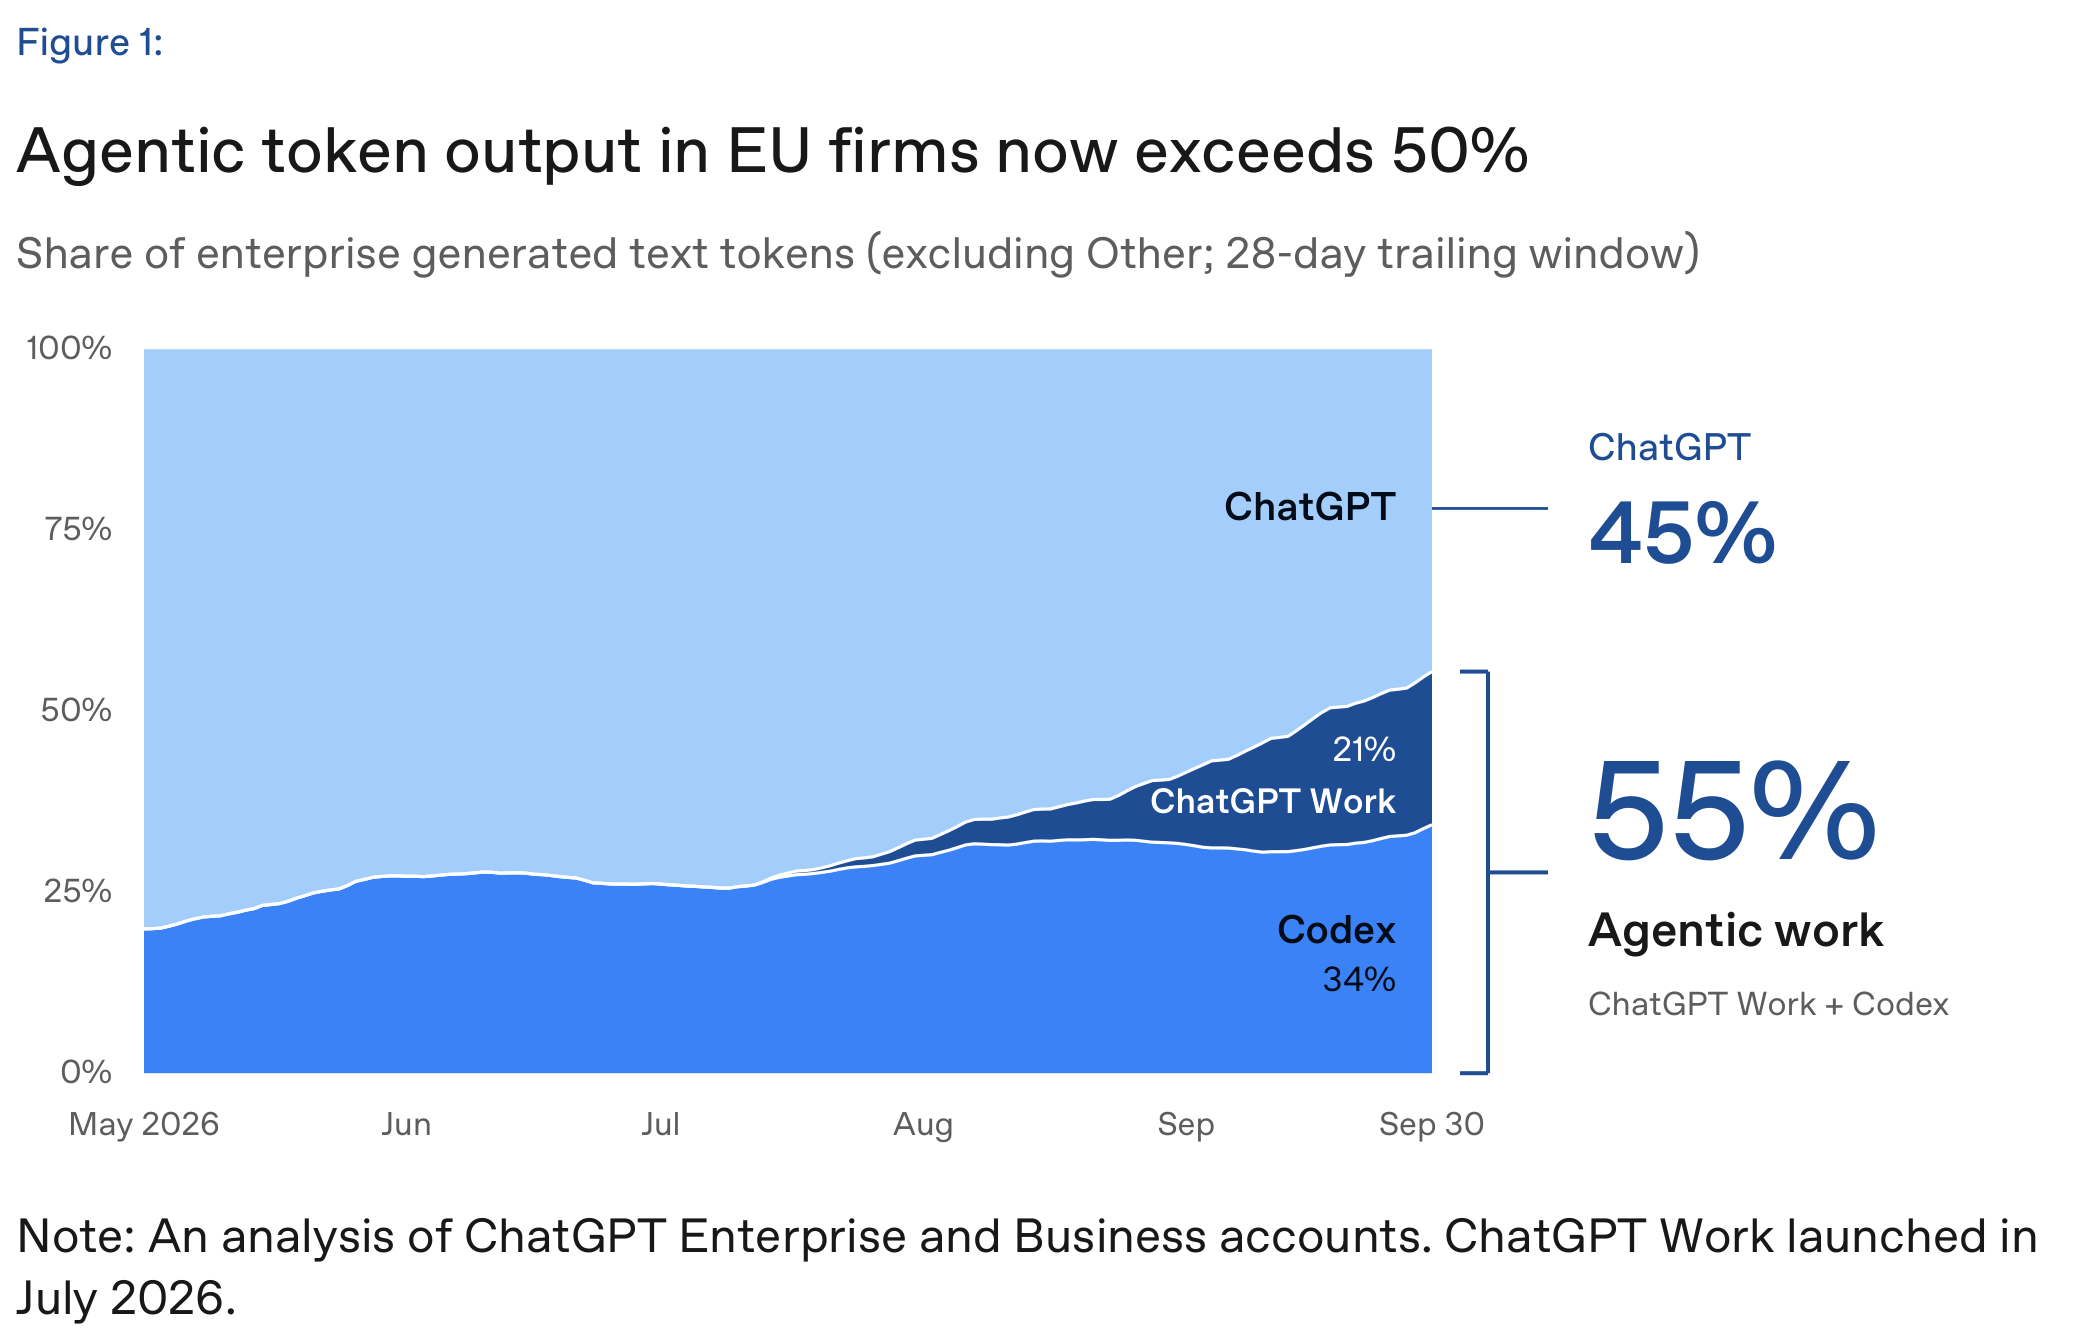
source: OpenAI Economic Research, Europe's Agentic Opportunity (2026-10). Sample covers ChatGPT Enterprise and Business accounts; shares of business text output tokens on a rolling 28-day basis, excluding Other.
This is a share of tokens, it covers only EU business accounts, and it is not revenue. It shows the direction, not yet the scale.
The second exit is a product form nobody can see today. It may well exist, but it cannot be predicted or modeled, so I do not treat it as the base case.
The third exit is spending a little less. If capex growth slows, the hurdle rises more slowly and revenue has time to catch up. That would matter little for AI's long-term progress, but it would hit the AI Trade directly.
GS's research notes that what chip companies sell to the clouds broadly tracks their customers' capex in the same year. Suppliers' revenue levels follow capex levels, and their growth follows capex growth. Hardware valuations are a bet on how long capex can keep rising; if revenue cannot catch up with the bill, that runway gets shorter.
The market has already begun to price the third exit. After NVIDIA's second-quarter results, most sell-side analysts raised their earnings forecasts while cutting their target multiples: Bank of America went from 27 times to 22 times, Bernstein from 25 to 21. Rising rates are also weighing on valuations, but in my ASML third-quarter review published on October 15, I saw the same combination: earnings up, multiples down.
In May, in my NVIDIA first-quarter review, I wrote that I leaned toward treating AI infrastructure spending of \$3tn–\$4tn a year by 2030 as the base case. On today's revenue curve, that scenario needs the first exit to happen first. Until I see models climb another step, I am moving it from base case to conditional case.
Part Seven: Five Readings That Will Give Answers First
The first to arrive will be the clouds' third-quarter results at the end of October: watch whether 2027 capex guidance is revised down. A cut would lower the hurdle, and it would also signal that the third exit has begun.
The revenue reading is the two labs' combined monthly growth: whether it can hold above 10% while slowing by no more than 0.2–0.5 points a month. Anthropic plans to list in November, and its public prospectus may provide audited quarterly revenue along with the method behind its annualized revenue.
The price reading is whether token spending can keep up with token usage. Ramp's monthly data will give the first signal; the faster Opus 5.5 is adopted through enterprise cloud channels, the faster unit prices will fall.
The usage reading is the share of work beyond coding, including OpenAI's ChatGPT Work and the share of non-coding tasks in the Anthropic Economic Index.
The substitution reading lies in labor data: when the first companies tick the AI box on Connecticut's layoff notices.
Closing
AI will very likely change how a great deal of work gets done; my view on that has not changed. The AI Trade is a bet on something narrower: that those changes turn into revenue before the bill comes due.
On October 13, the IMF's Global Financial Stability Report mapped the financing ties among 14 AI companies: \$300bn of equity investment, \$650bn of debt and \$1.4tn of future revenue commitments, all intertwined, with about half of the debt carried by the companies being invested in. In the years when revenue runs late, that web will have to front the bill.
If the 2028 bill arrives on time and the revenue arrives two years late, how long can the web hold?


