
ASML Q4 2025 Earnings Review: From "Unable to Confirm Growth" to "Multi-Year Upswing Confirmed"
Can ASML's record €13.2 billion order quarter — nearly double the Street's estimate — finally settle the debate over its multi-year growth trajectory?


Six months ago, during its Q2 2025 earnings call, ASML management delivered a statement that sent a shiver through the market: they "could not confirm growth for 2026." Macroeconomic uncertainties loomed large, tariff clouds gathered, and the question of whether lithography intensity had peaked became a central concern for investors. Our analysis at the time maintained a cautious stance — viewing the situation as a cyclical recovery rather than an endlessly extending "supercycle."
By Q3, management offered a partial reassurance: 2026 revenue would be "not lower than 2025." BNP Paribas aptly summarized the sentiment — "flat is the new up." It was a de-risking event, not a re-rating event.
Now, with Q4 2025, ASML has delivered a set of numbers that shifts the narrative yet again. The question is whether this shift is as definitive as the headline figures suggest.
Orders: A Striking Number — and What It Does (and Doesn't) Tell Us
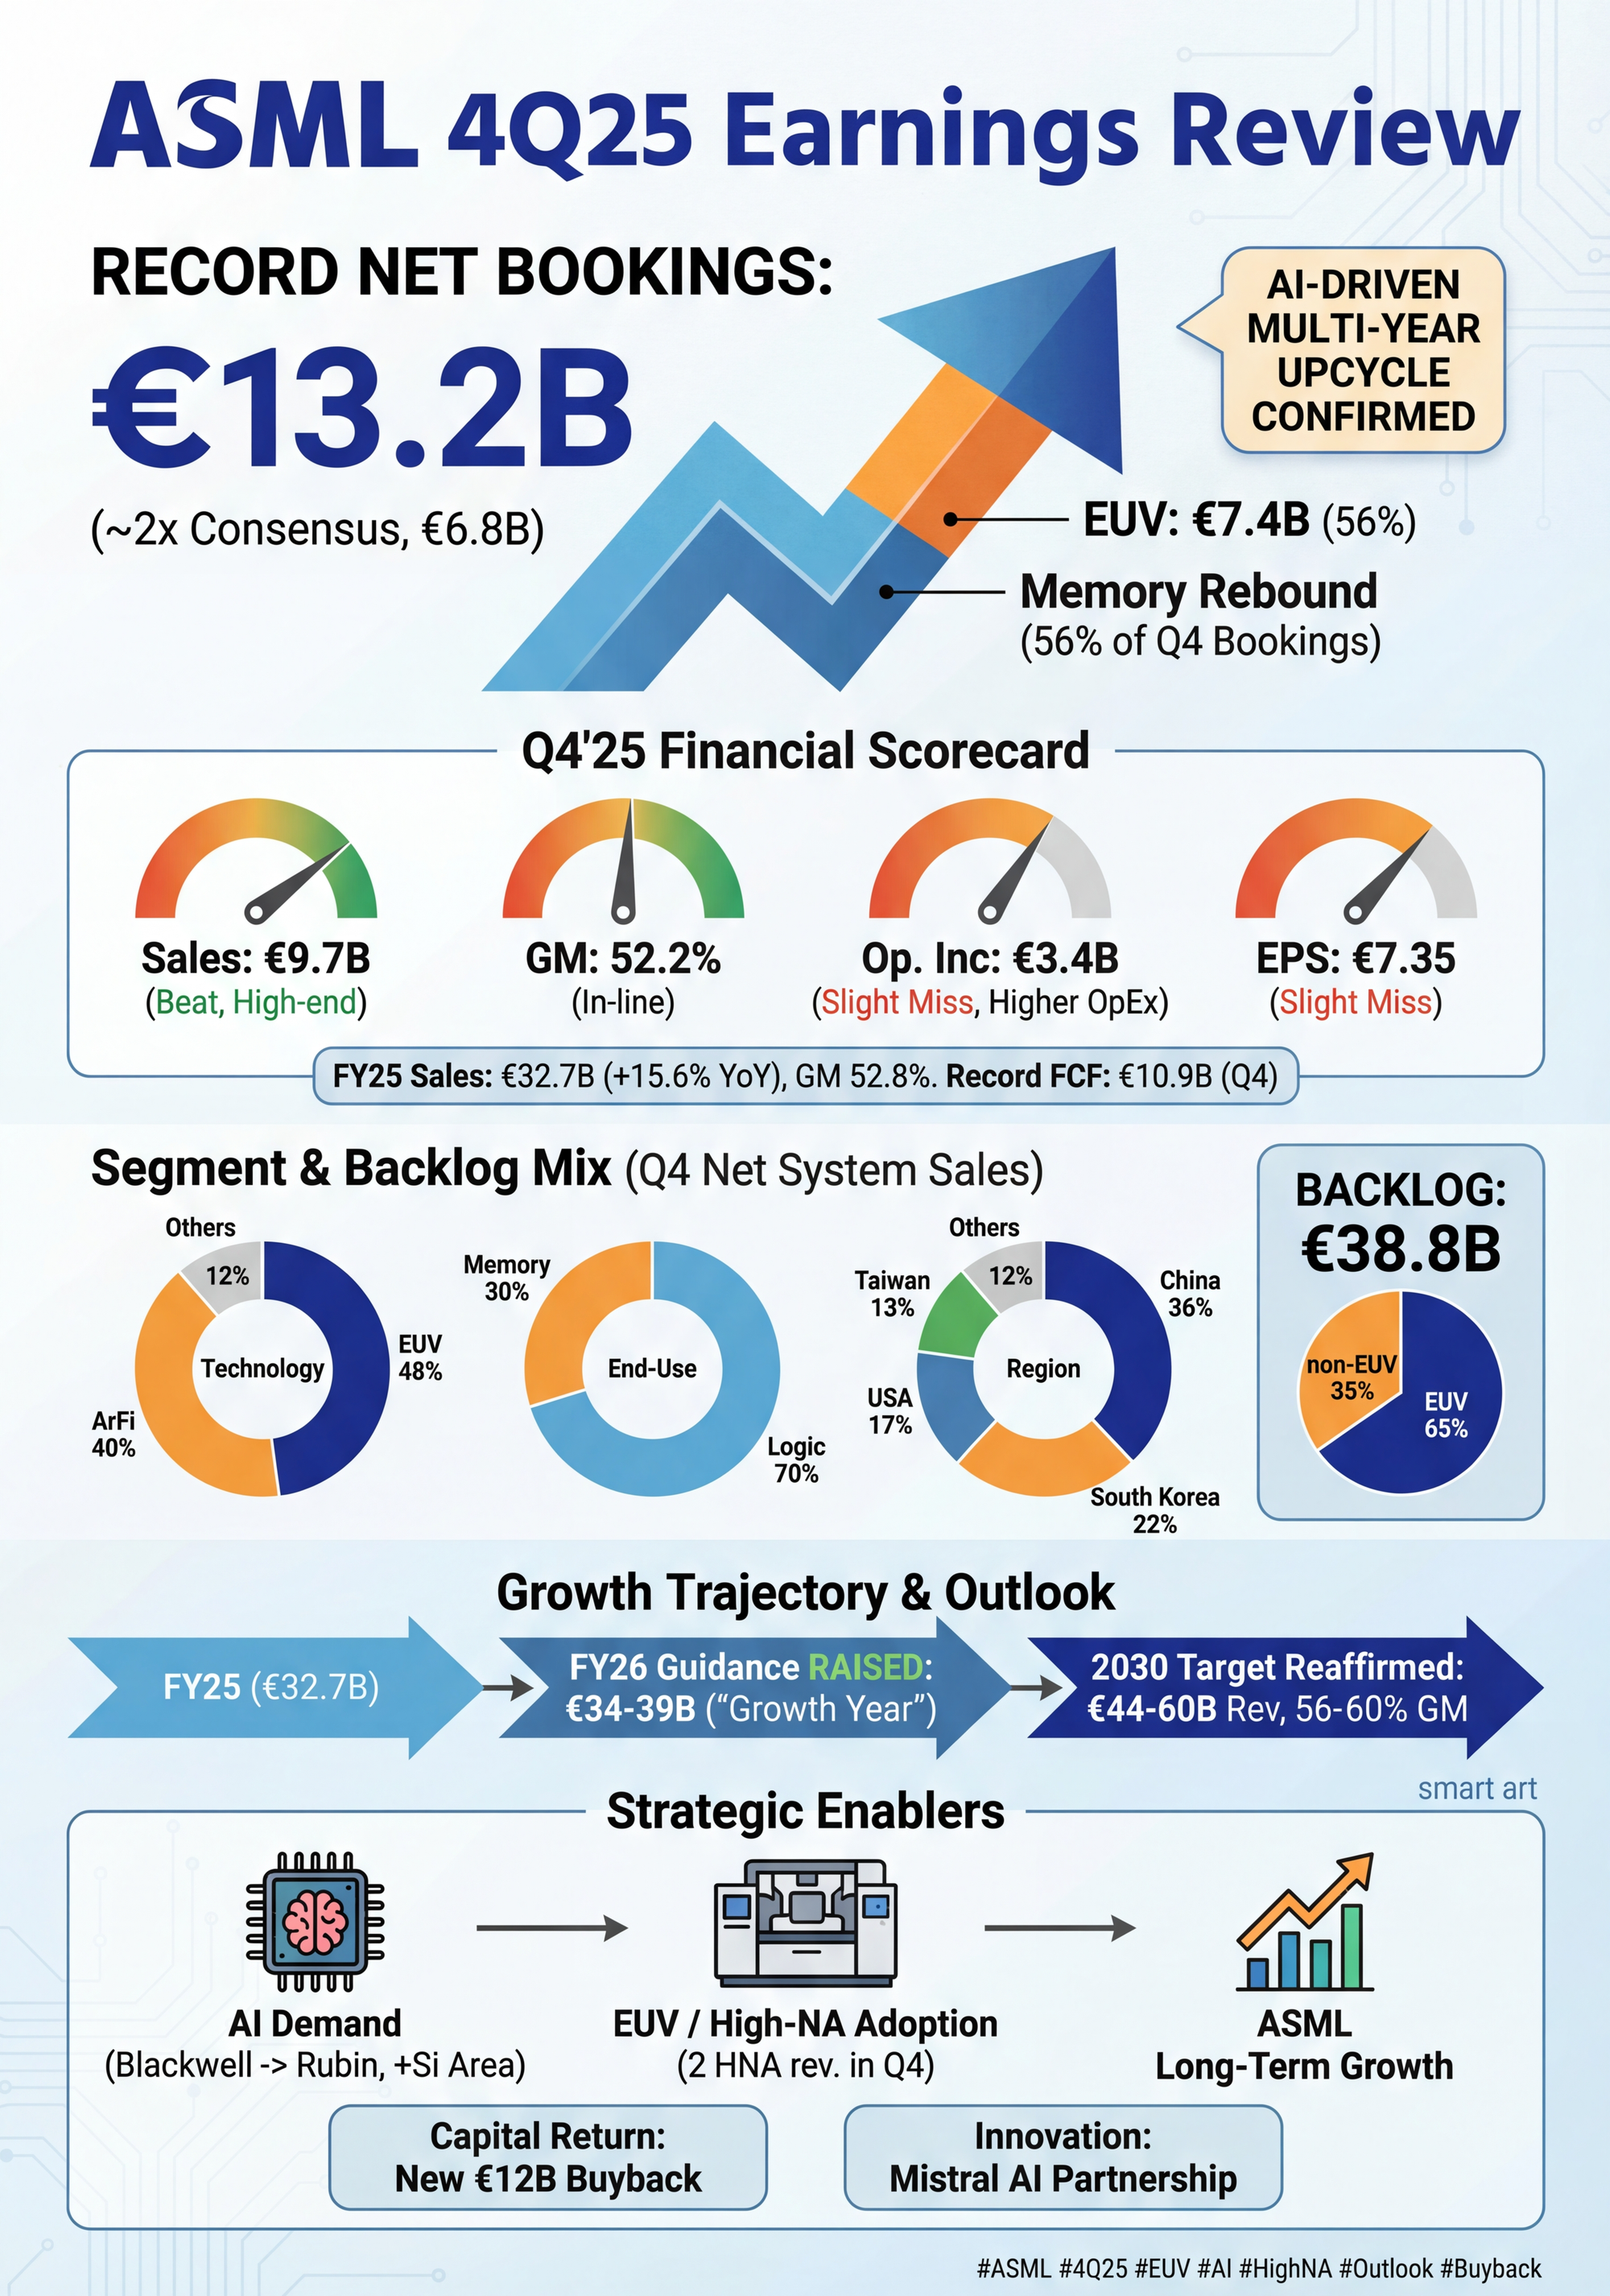
The headline figure is €13.2 billion in quarterly net bookings, nearly double the €6.8 billion market consensus. EUV orders alone reached €7.4 billion — exceeding Wall Street's expectations for total orders. Sequentially, bookings surged 144%; year-over-year, 86%.
ASML Q4 2025 Performance Overview
source: Prepared by Jason & Jarvis
Yet a few observations temper the initial impression. First, ASML's order pattern has always been "lumpy" — management has consistently cautioned against reading too much into any single quarter. In Q1 2025, bookings of €3.9 billion badly missed the €4.8 billion consensus; one quarter later, €5.5 billion beat. The swing from Q1's miss to Q4's massive beat is a reminder that these ordering cycles are driven by a handful of large customers making concentrated decisions. The fact that the "majority" of Q4 orders are targeted for 2027 delivery means much of this demand is being placed well in advance — a sign of confidence, perhaps, but also a data point that invites the pull-in question: are customers locking in capacity now that they may not ultimately need at the pace assumed?
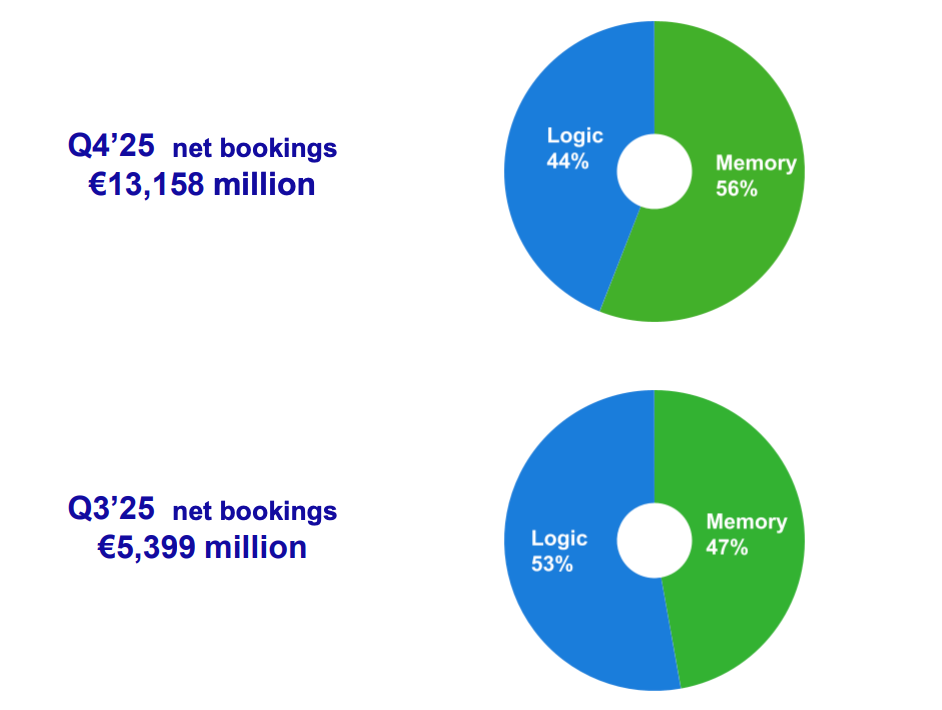
The composition shift is more informative than the absolute number. Memory customers accounted for 56% of Q4 orders, surpassing Logic at 44%. This is a structural departure. Throughout most of 2025, ASML's growth narrative revolved around advanced logic (primarily TSMC). The emergence of DRAM as the larger order contributor — driven by HBM demand and the transition to 1C/1D nodes requiring more EUV layers — signals that the demand base is broadening. Whether this broadening proves durable or represents a concentrated capex burst from memory players remains to be seen.
Quarterly Orders by End Use
source: ASML
Current Quarter Performance: Solid, With a Few Caveats
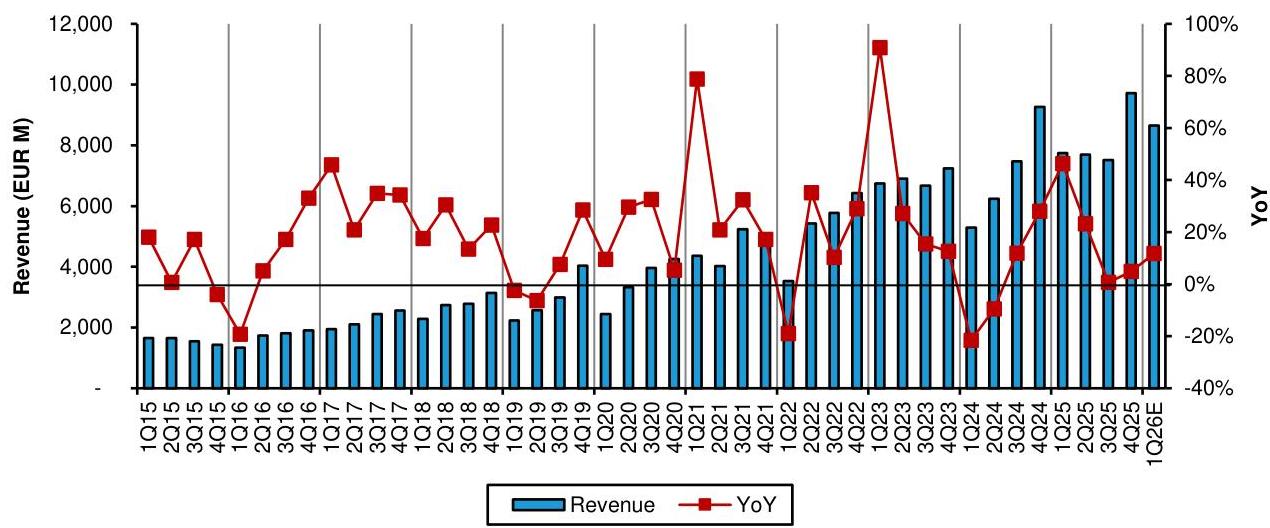
Q4 2025 revenue of €9.72 billion came in at the high end of guidance (€9.2-9.8 billion), beating the €9.56 billion consensus. Gross margin of 52.2% edged above the 51.94% expectation. Full-year revenue reached €32.7 billion, up 15.6% year-over-year.
ASML Q4 2025 Revenue Performance
source: Bernstein
The profit line, however, showed small cracks. Operating income of approximately €3.42 billion slightly missed the €3.43 billion consensus; EPS of €7.35 fell short of the adjusted €7.53 expectation. The gap came from R&D and SG&A costs running above expectations, largely due to non-recurring personnel expenses. ASML simultaneously announced an organizational restructuring that will cut approximately 1,700 positions in its technology and IT departments — a reminder that even a company at the apex of a growth cycle faces internal cost pressures.
Free cash flow was a genuine bright spot: €10.9 billion in Q4, bringing the full-year total to €11 billion.
The DUV Story That Gets Overlooked
Amid the excitement around EUV orders, the DUV segment tells a more nuanced story that deserves attention.
Full-year DUV system sales declined 6% to €12.0 billion, and the Q&A revealed that non-China DUV business was "disappointing" in 2025. Customers prioritized long-lead-time EUV orders while maintaining flexibility on shorter-cycle DUV purchases — effectively pulling back on DUV commitments. ArFi (immersion) supply constraints also shifted the DUV product mix toward lower-margin Dry systems.
Meanwhile, China's share of DUV revenue climbed to 75% in Q4, according to Bernstein. This concentration is striking: it means the non-China DUV business — in theory the "normalized" baseline — was weak enough that three-quarters of DUV revenue came from a single, geopolitically constrained geography. Management guided China revenue to approximately 20% of the total in 2026, which implies a significant drop from the 35% level seen in 2025.
Bernstein has recently argued that the consensus may be underestimating DUV. Their thesis: the historical DUV-to-EUV capex ratio remains roughly 50:50, meaning that for every incremental dollar of EUV revenue, there should be a corresponding dollar of DUV. If so, consensus estimates showing EUV growing by €2.3 billion while DUV declines by €1 billion in 2026 would be "directionally inconsistent." The counterargument is that China's stocking cycle may have artificially inflated DUV in 2024-2025, and the reversion could be sharper than expected. This debate is far from settled.
2026 Outlook: The Wide Range Is the Message
Management set 2026 revenue guidance at €34-39 billion. Relative to the prior "not lower than 2025" framing, this is a clear upgrade — 2026 is now officially a growth year, not a floor-setting exercise.
Yet the €5 billion spread between the low and high end of the range should not be dismissed. It represents a 15% variance — substantial by any standard. ASML attributed this width to customer-side uncertainties: fab construction timelines, cleanroom readiness, and the pace at which clients can absorb equipment. The company is emphatic that its own production capacity is not the bottleneck — it has infrastructure for 90 Low NA EUV and 600 DUV systems annually.
The Q1 2026 guide of €8.55 billion at the midpoint (above €8.13 billion consensus) provides near-term visibility. But the full-year trajectory is expected to be heavily second-half weighted, which means the first half offers limited confirmation of whether ASML is tracking toward the high or low end.
There is also the broader question of whether AI-driven semiconductor capex is translating into sustainable end-demand at the rate the current order book implies. Hyperscaler capex plans remain aggressive, but the link between AI infrastructure spend and the specific lithography tools required to fulfill that demand runs through multiple intermediaries — foundries, IDMs, and their respective capacity utilization assumptions. The order book reflects intent; execution remains a separate variable.
Gross Margin: The Mix Headwind Is Real
The 2026 gross margin guide of 51-53% represents a slight step down from 2025's 52.8%. The drivers are well understood:
The EUV product mix will skew toward older NXE 3600D systems from backlog, rather than the higher-margin 3800E. TSMC Arizona, for instance, is prioritizing 3nm capacity (which uses 3600D) over 2nm. On the DUV side, Immersion supply constraints mean more lower-margin Dry systems in the mix. Early High NA EUV systems also carry lower margins during the initial ramp.
The bull case for 2027 margins is straightforward: the mix shifts toward 3800E and 3800F models, High NA scales up the learning curve, and Installed Base Management continues to grow. Management reiterated its 2030 target of 56-60%. But 2026 will be a year where margin progress stalls, and any execution slip on the product transition could extend that pause.
Litho-Intensity: The Structural Argument, and Its Limits
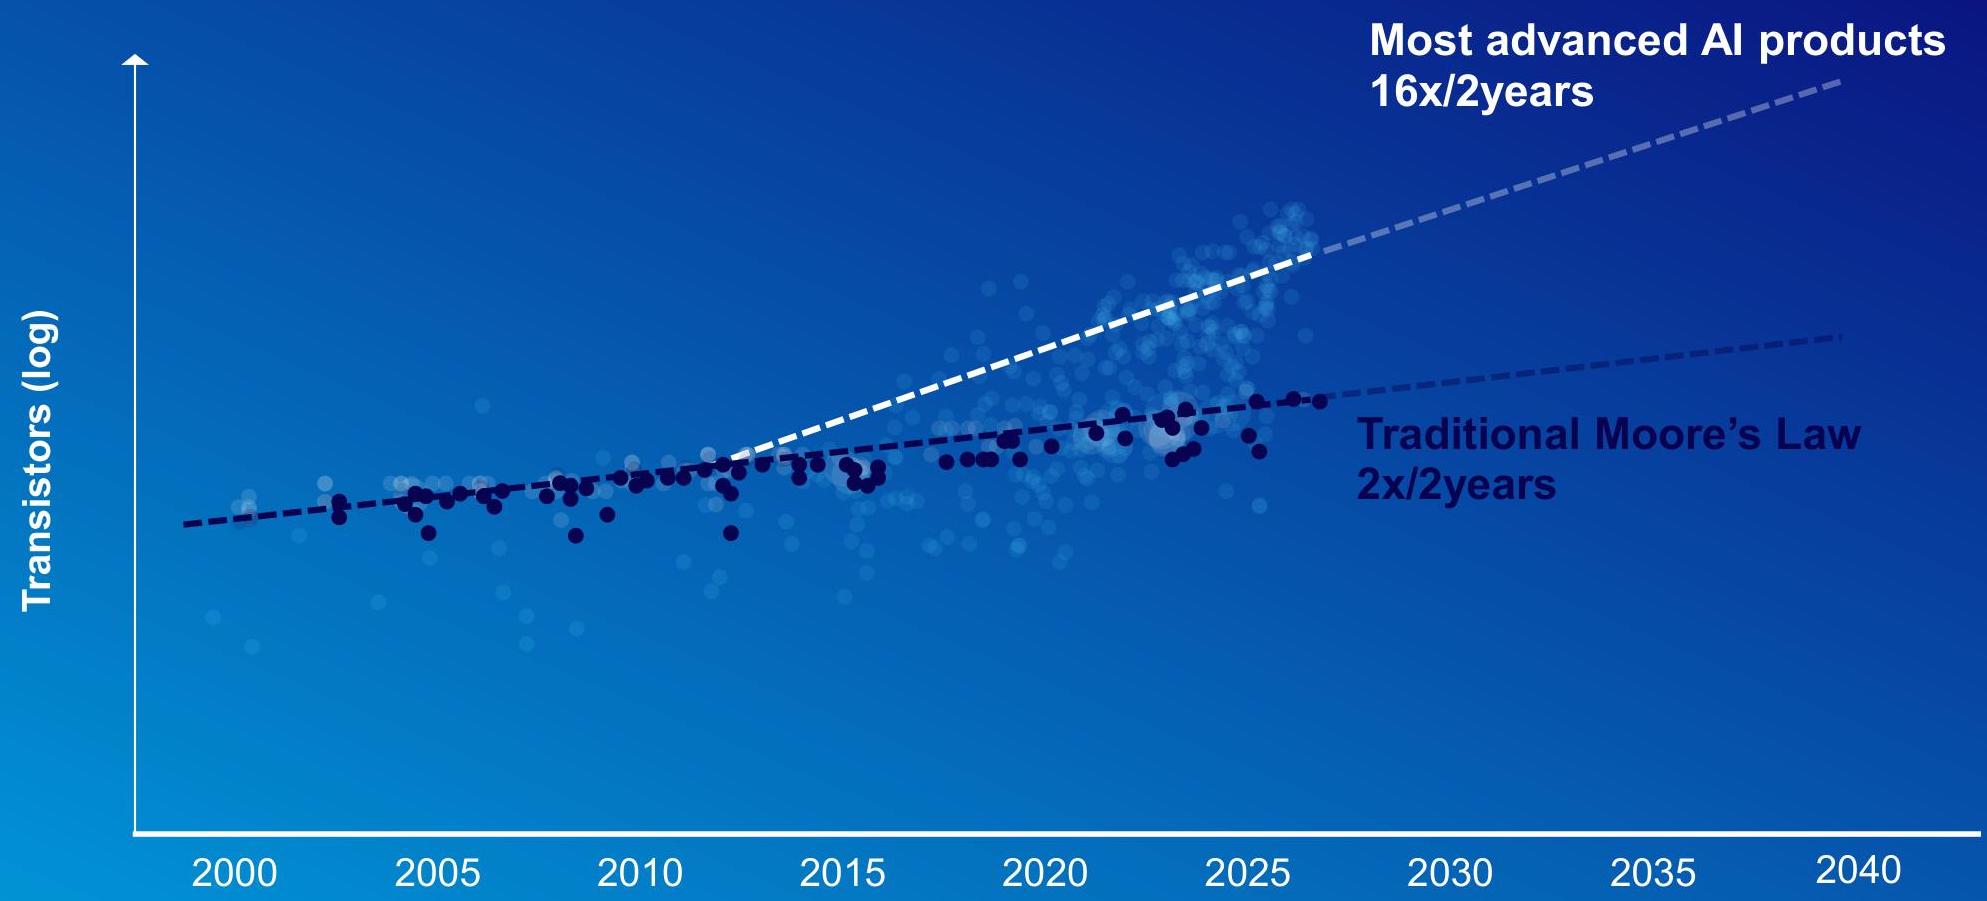
The strongest bull case for ASML rests not on any single quarter's orders, but on the structural thesis that lithography intensity — the share of wafer fab equipment (WFE) spending allocated to lithography — is rising rather than falling.
AI Compute Demand vs. Moore's Law
source: ASML Press Conference
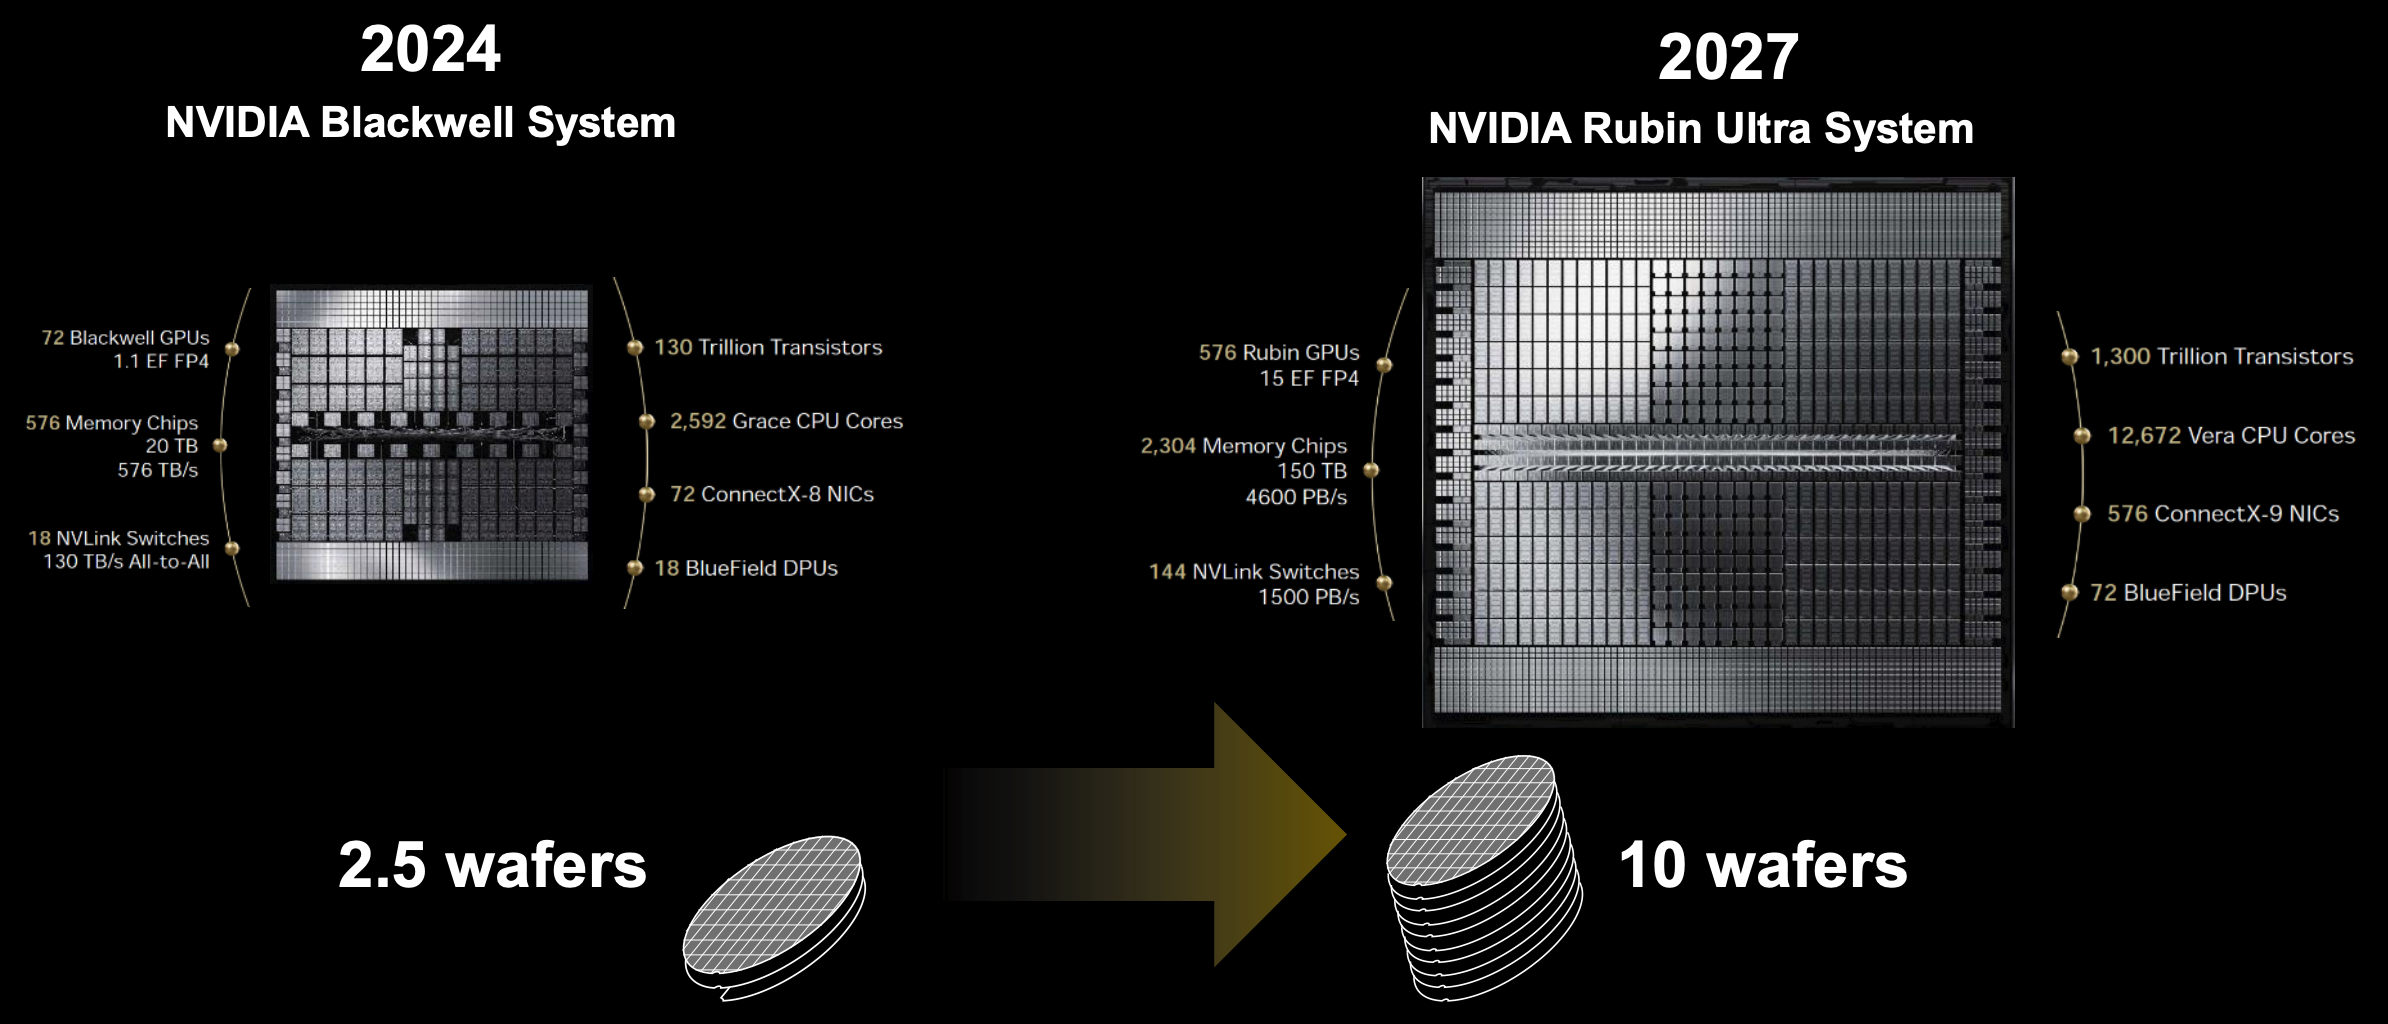
Some esetimated data supports this in the near term. BofA estimates litho intensity rose from 23.7% of WFE in 2024 to 24.5% in 2025, driven by higher-than-expected EUV adoption in DRAM. In DRAM specifically, EUV layer counts are increasing: from 4 layers at the 1B node to an estimated 7 at 1C and 10 at 1D. Logic's A14 node is expected to add 10-20% more EUV layers versus current nodes.
Silicon Area Requirements for Advanced NVIDIA Systems
source: ASML Press Conference
Yet this thesis is not without its complications. The transition from 6F² to 4F² DRAM architecture around 2028 could flatten EUV layer counts at 10 layers, creating a potential plateau. Management countered this during the Q&A by arguing that customers "don't like cliffs" and plan EUV insertion across multiple nodes to avoid tool idling — and that 4F² actually requires more litho steps overall (both DUV and EUV). BofA also noted two potential offsets: DRAM makers upgrading from 3600D to 3800E tools (invalidating re-use assumptions), and High NA adoption creating a replacement cycle. Whether these offsets materialize in practice is a 2028 question, not a 2026 one — but it shapes the debate about cycle duration.
 Jason & Jarvis
Backlog and Visibility: Strong, But Forward-Loaded
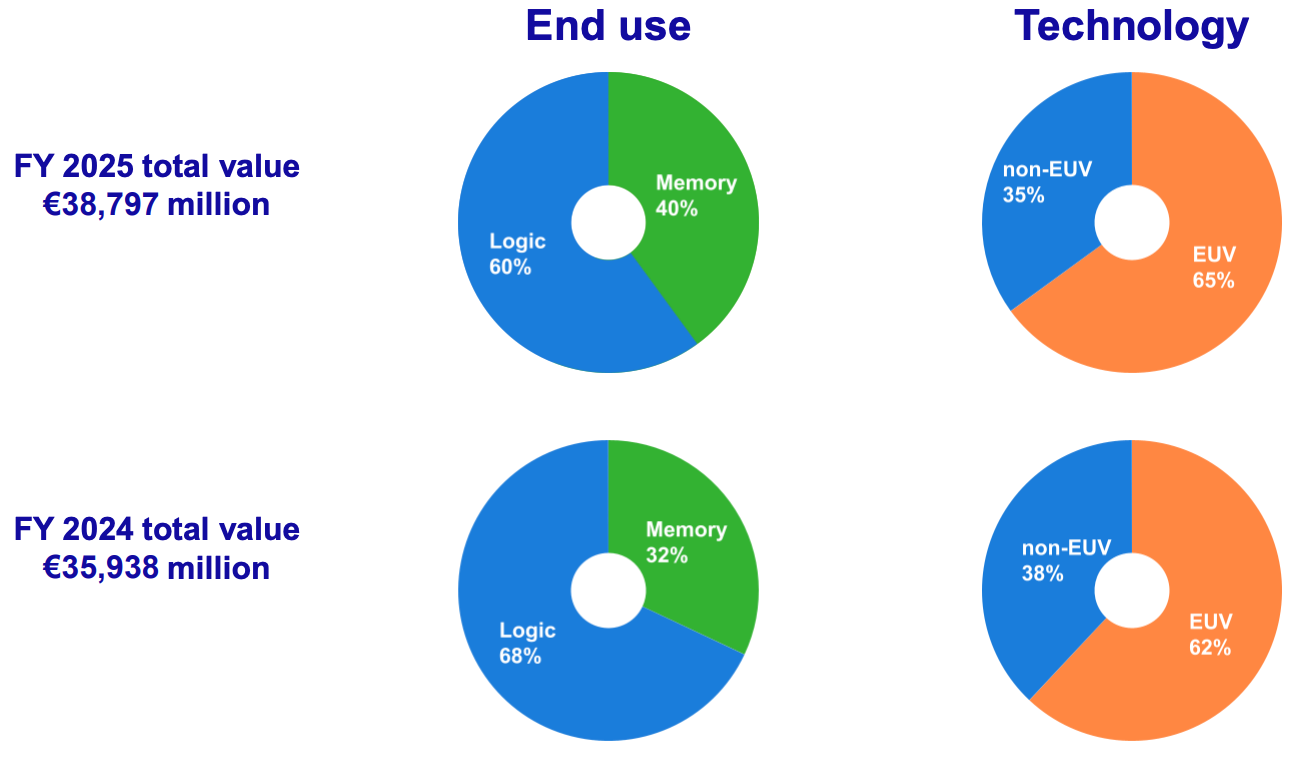
ASML ended 2025 with a backlog of €38.8 billion, well above the €32.8 billion consensus. EUV accounted for 65% of the total, with Logic at 60% and Memory at 40%.
Backlog by End Use and Technology
source: ASML
The "majority" of these orders target 2027 delivery. On one hand, this provides unusual revenue visibility. On the other, it concentrates execution risk into a specific window — and the question of whether all of this backlog converts to revenue at the pace currently assumed is non-trivial. Customer fab construction delays, shifts in technology roadmaps, or a downturn in end-demand could all affect conversion rates.
CEO Fouquet stated that recent dynamics confirm the company's November 2024 Investor Day framework: an opportunity to reach €44-60 billion in annual revenue by 2030. This remains a wide range, and the path from €34-39 billion in 2026 to that target depends on assumptions about AI capex durability, High NA adoption pace, and the China trajectory — each of which carries meaningful uncertainty.
Valuation: The Market's Hesitation
Despite the strong print, ASML's stock closed down 2% on earnings day. The market's skepticism is worth noting, not dismissing.
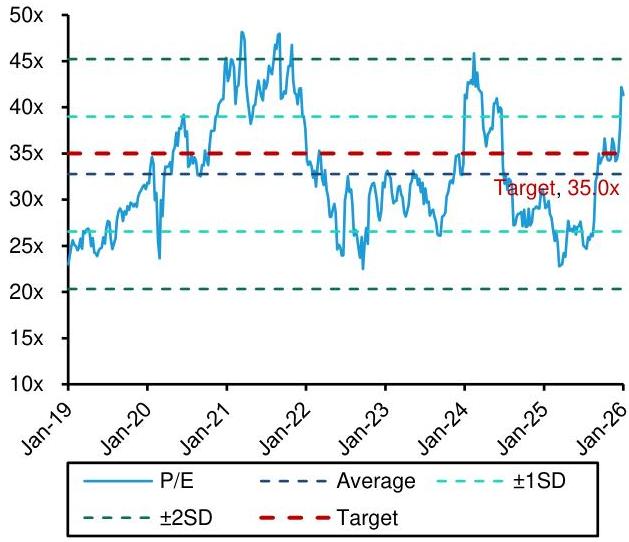
2019-2026: ASML 1-Year Forward P/E Ratio
source: Bernstein
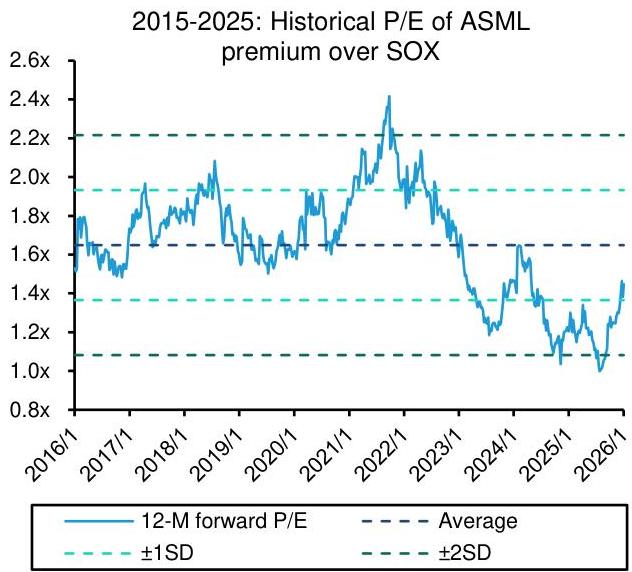
2015-2025: ASML's Historical P/E Premium Relative to SOX
source: Bernstein
At approximately 24x forward earnings, ASML trades below its historical average, near negative one standard deviation. Its premium relative to the SOX index and SPE peers has compressed to multi-year lows. This divergence between improving fundamentals and declining multiples is not uncommon in the middle innings of a semiconductor cycle — investors tend to start pricing in peak risk precisely when the data improves most visibly. Whether the market is being irrationally cautious or prudently forward-looking is a question the next two to three quarters will help answer.
What Has Changed — and What Hasn't
Over the past six months, we have tracked ASML through a clear narrative progression: from Q2 2025's"unable to confirm growth"
 Jason & Jarvis
to Q3's "not below 2025"
 Jason & Jarvis
to today's €34-39 billion guidance and a €38.8 billion backlog. The direction of travel is unambiguous — the data has improved at each step.
Yet the framework for evaluating this cycle has not fundamentally changed. The core questions remain the same: Is litho-intensity structurally rising, or are we observing a concentrated DRAM capex burst that will normalize? Can AI infrastructure spending sustain at the pace the current order book implies? Will non-China DUV recover, or has China's stocking cycle masked a weaker underlying baseline? And how much of the €13.2 billion Q4 order reflects genuine medium-term demand versus clients front-loading commitments in an uncertain geopolitical environment?
The data has moved in ASML's favor. But strong quarters have a way of making structural arguments feel more convincing than they might be — and the €5 billion spread in 2026 guidance is management's own acknowledgment that execution-level uncertainty remains substantial. Client fab construction timelines, China revenue normalization (from ~35% to a guided ~20%), and the DUV transition dynamics all represent variables with meaningful ranges of outcomes.
Key observation windows ahead: July 2026, when management typically narrows the annual guidance range; the trajectory of non-China DUV recovery in H1; and the anticipated wave of High NA EUV order decisions in H2 2026.
The above analysis is a comprehensive synthesis based on ASML's official earnings reports, press conference materials, and sell-side research from Bernstein, J.P. Morgan, and BofA. It does not constitute investment advice.
I will share a more detailed analysis of this earnings result & earnings call be hind the paywall:


