
Nintendo 3Q26 Earnings Review: The Profit Margin Trade-Off Behind a Revenue Doubling
When Nintendo's revenue nearly doubles but margins collapse by 20 percentage points, is Switch 2's blockbuster launch a triumph or a warning sign?


Nintendo 3Q26 Earnings Review: The Profit Margin Trade-Off Behind a Revenue Doubling
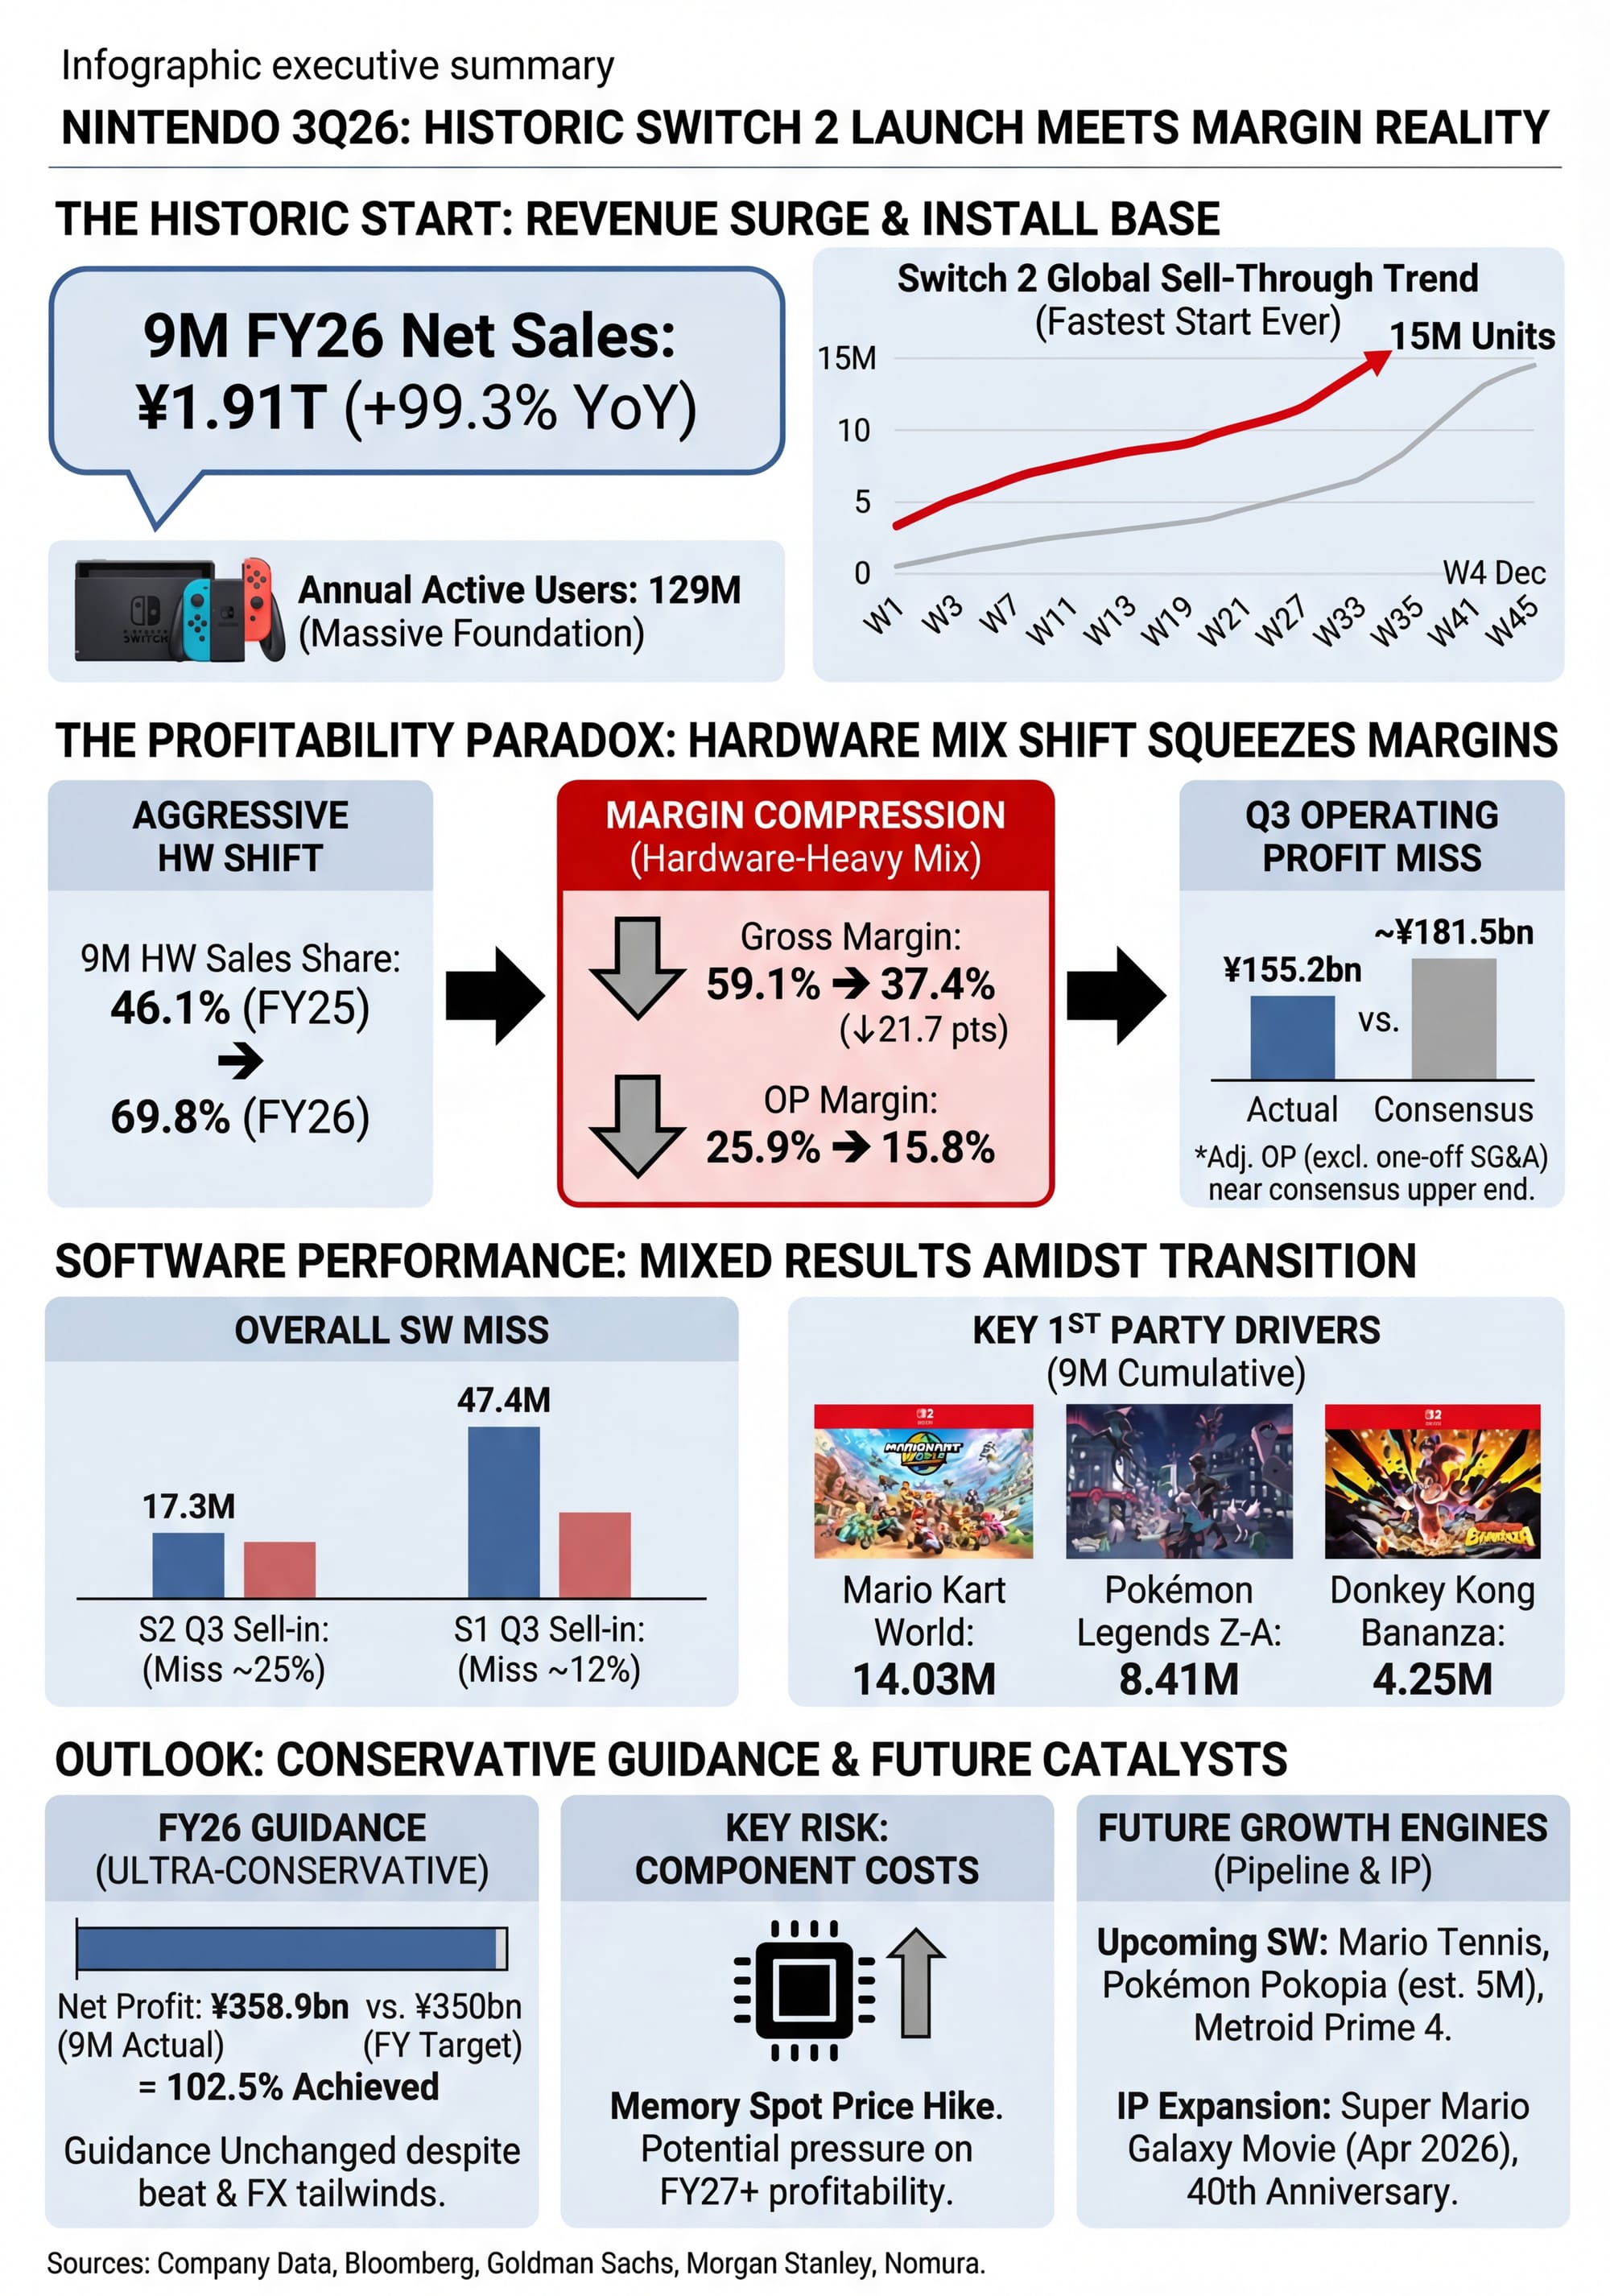
Nintendo just delivered a quarter that demands careful parsing. For the first nine months of FY26 (ending December 31, 2025), net sales reached ¥1.91 trillion, up a staggering 99.3% year-over-year. The star of the show is unmistakably Nintendo Switch 2—the fastest-selling dedicated gaming platform in Nintendo's history.
Yet this earnings report also lays bare a classic business dilemma of console transitions: when low-margin new hardware rapidly dominates the sales mix, even a near-doubling of revenue comes with intense pressure on profitability.
Revenue Doubling: Switch 2's Strong Start
Let's start with the good news.
Cumulative operating profit for the first three quarters reached ¥300.3 billion, up 21.3% year-over-year. Net income attributable to parent soared to ¥358.9 billion, a 51.3% jump. The strong net income performance was partly boosted by a ¥47.8 billion foreign exchange gain and ¥64.8 billion in equity method investment income from The Pokémon Company.
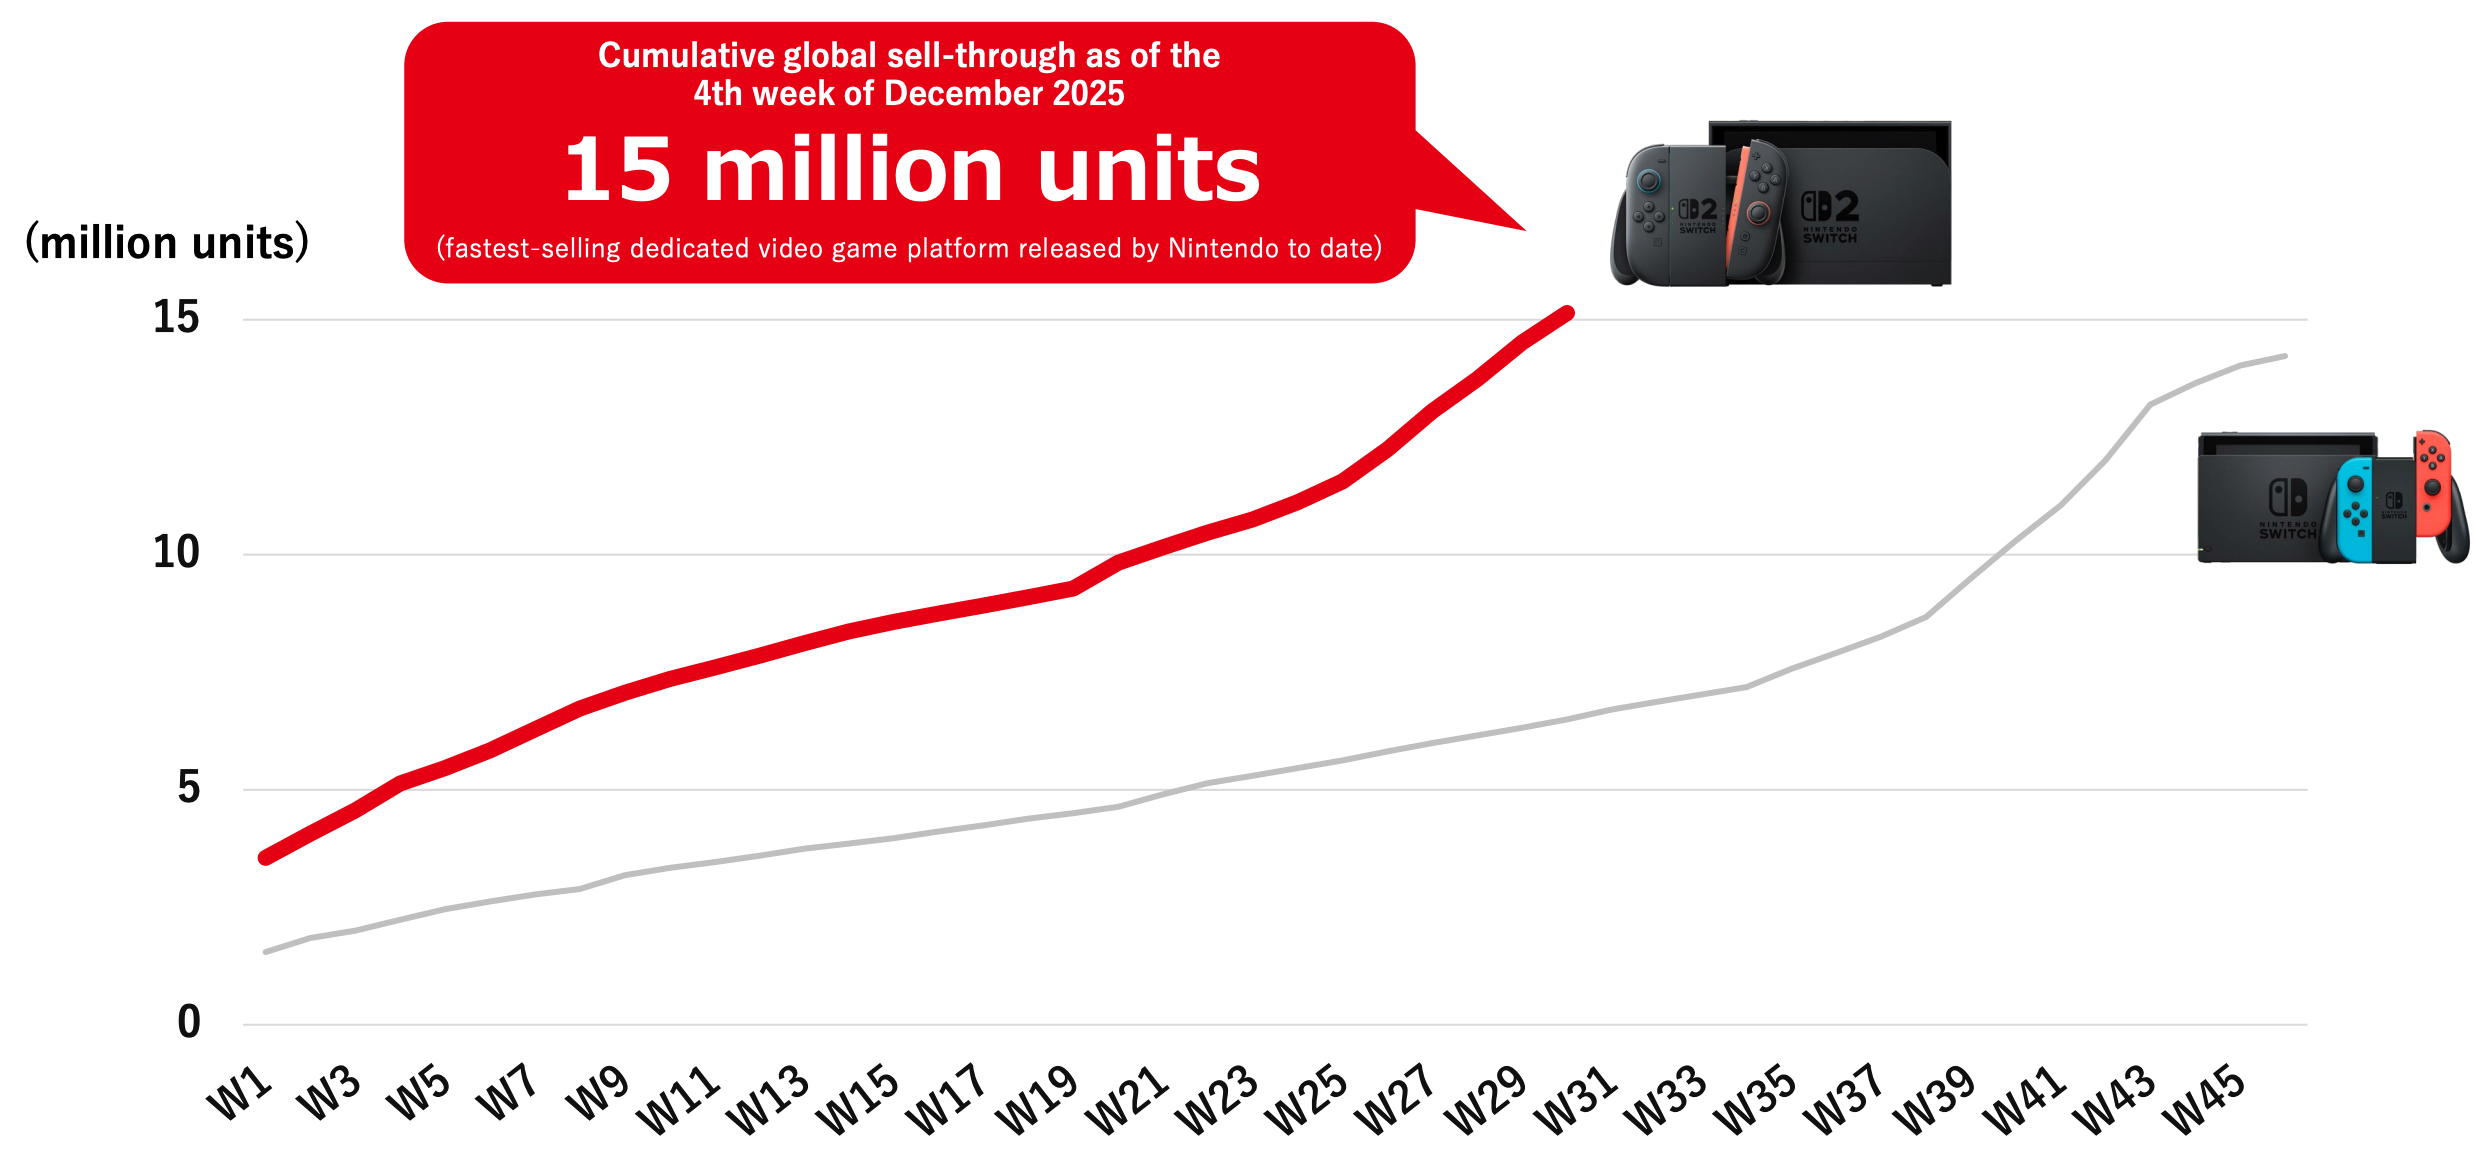
Switch 2 sell-in hit 7.01 million units in Q3 alone, exceeding the Bloomberg consensus estimate of 6.47 million by roughly 8%. Even more noteworthy is the sell-through data: as of the fourth week of December, cumulative global Switch 2 sell-through surpassed 15 million units, making it the fastest-selling dedicated gaming platform in Nintendo's history.
Switch 2 cumulative global sell-through trend
Source: Nintendo
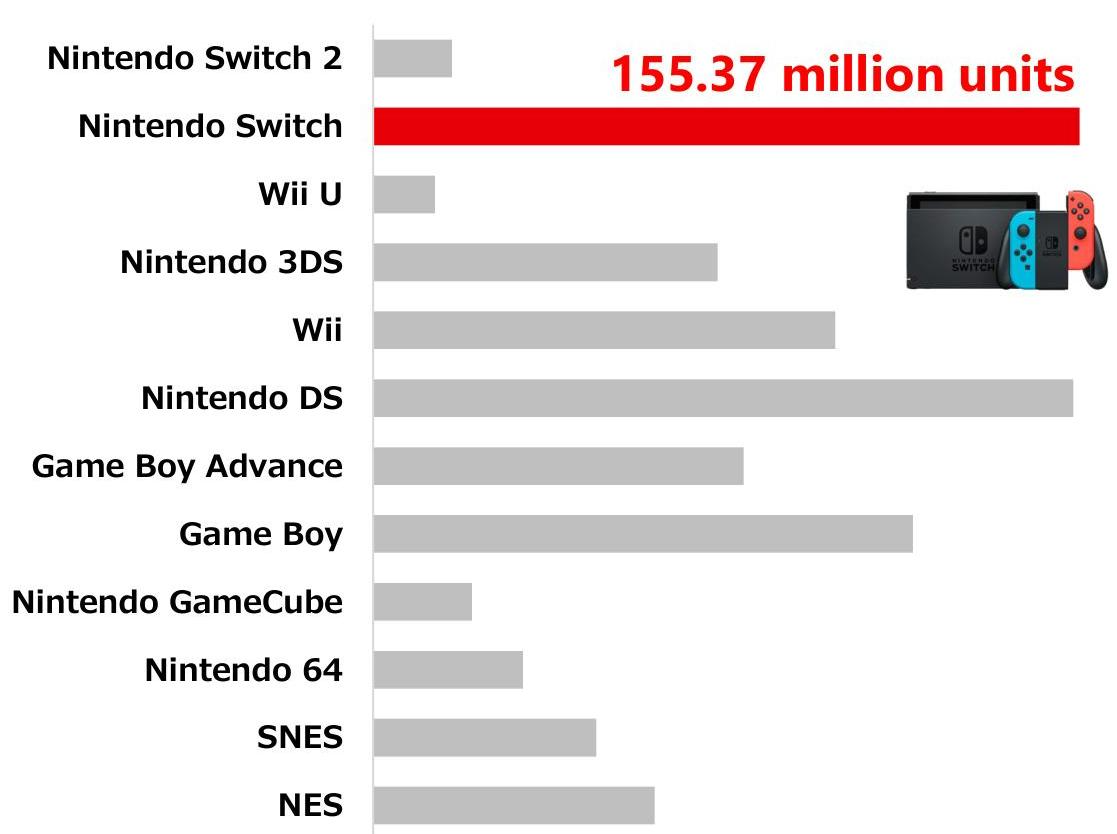
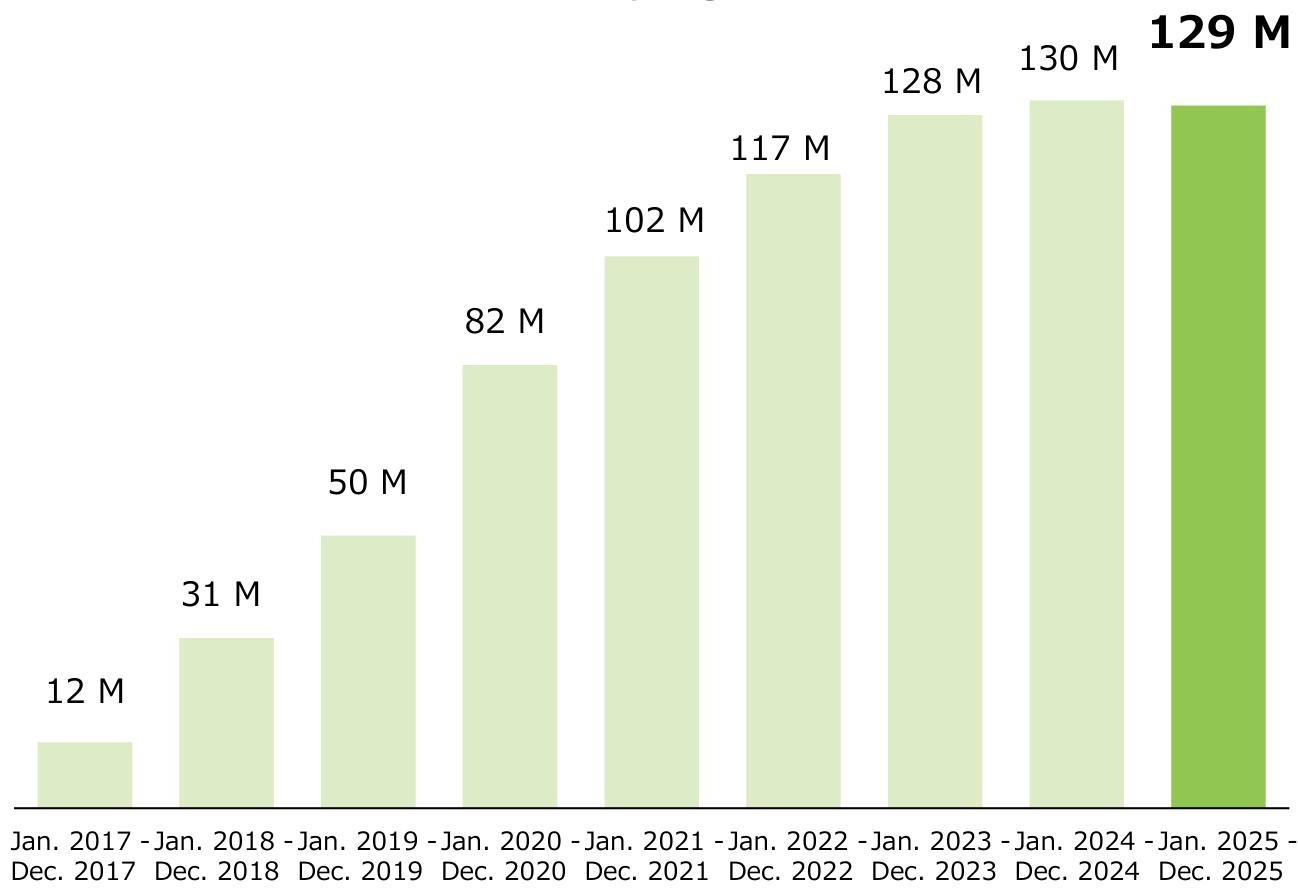
For context, the original Switch has now reached cumulative sell-in of 155.37 million units, officially surpassing the Nintendo DS to claim the throne as Nintendo's best-selling hardware ever. This means Switch 2 launches atop an unprecedented installed base—the company disclosed that annual active users stand at 129 million, essentially flat versus 130 million last year. This user stickiness is the critical foundation enabling Switch 2's rapid ramp.
Nintendo historical hardware cumulative sales comparison
Source: Nintendo
Margin Cliff: The Price of Surging Hardware Mix
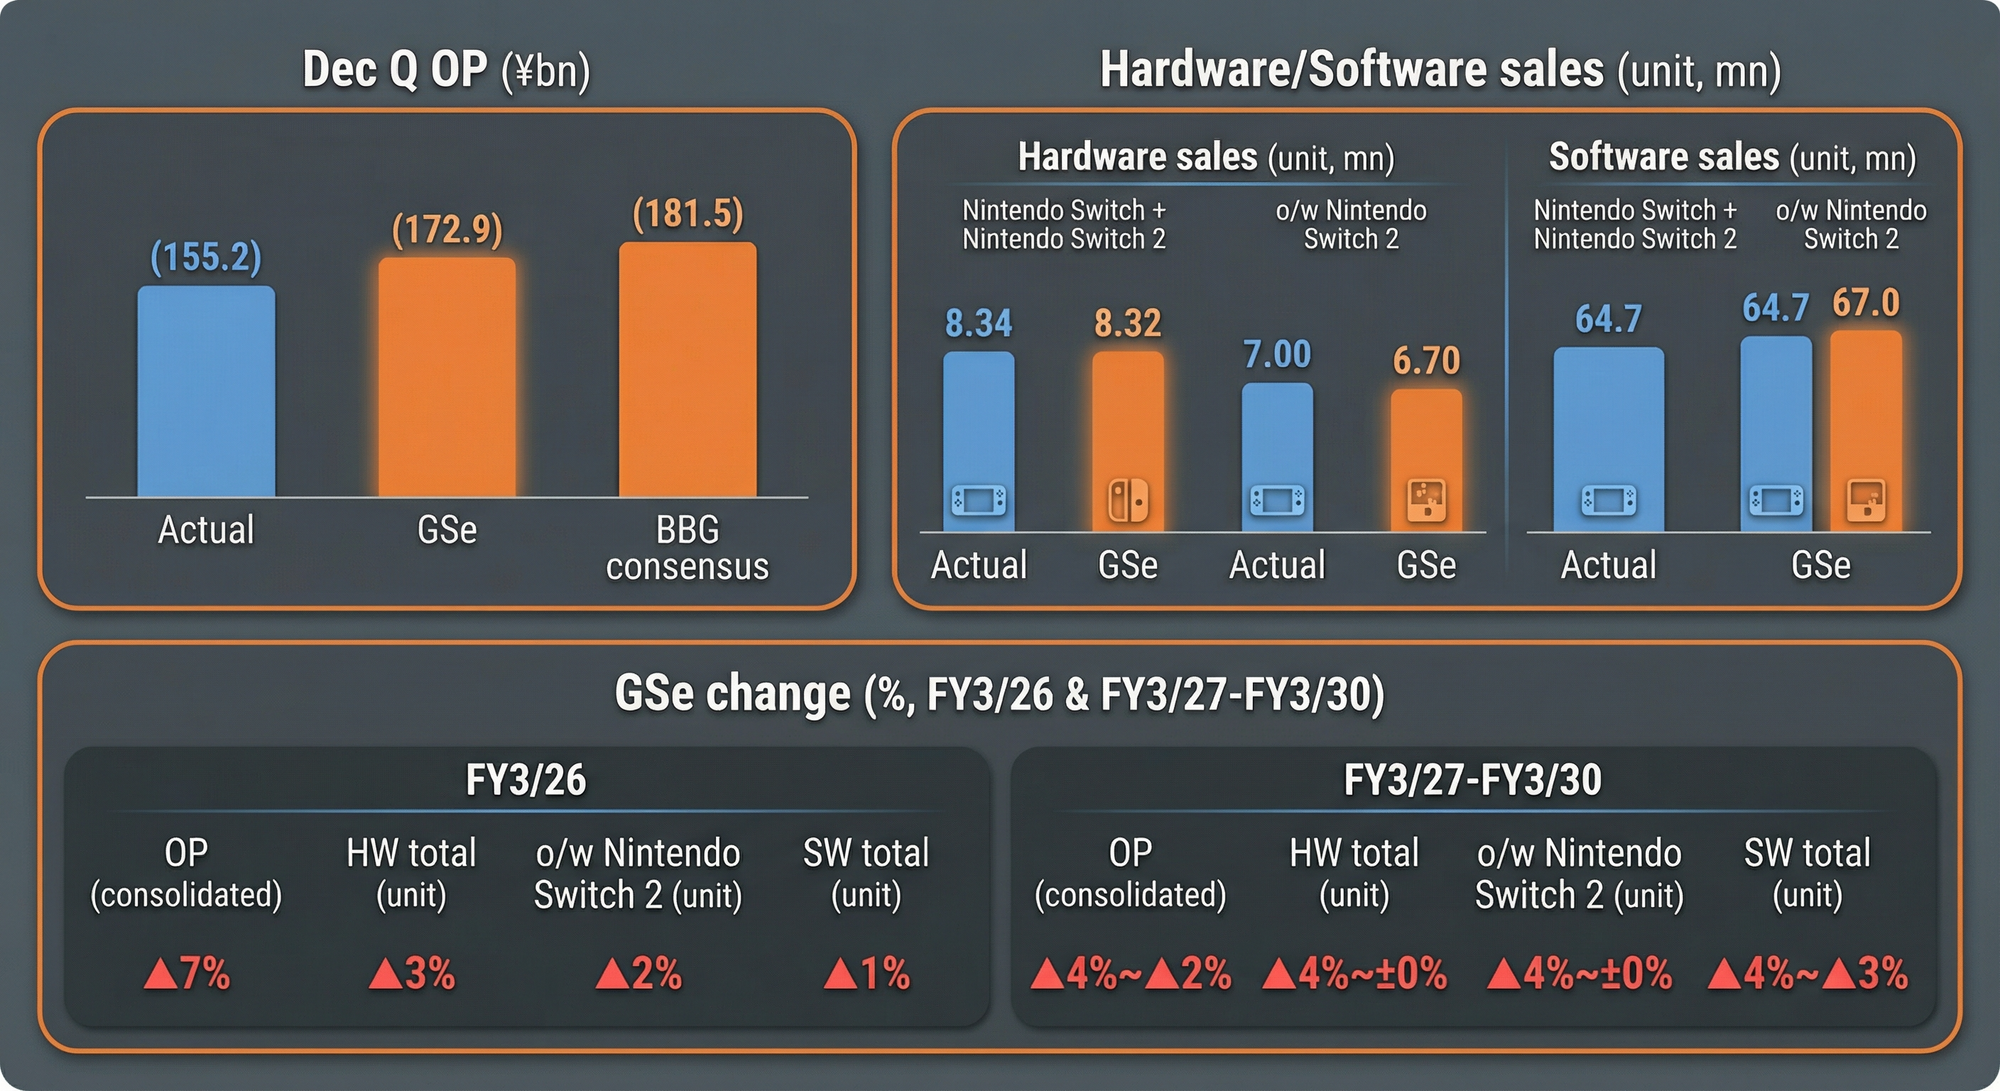
However, Q3 standalone operating profit came in at ¥155.2 billion, significantly below the sell-side consensus of ¥181.5 billion—a miss of roughly ¥15-26 billion.
The culprit isn't weak volumes. It's the dramatic shift in sales mix.
Hardware sales as a percentage of total platform revenue surged from 46.1% in the prior year to 69.8% in the first nine months—a 23.7 percentage point swing that hit margins directly. The company's overall gross margin plummeted from 59.1% to 37.4%, a 21.7 percentage point decline. Operating margin similarly compressed from 25.9% to 15.8%.
Goldman Sachs further dissected the profit miss: Switch 2 sales in the domestic Japanese market accounted for 35% of the total, higher than the expected 30%. Because the "Nintendo Switch 2 Japanese/Domestic Only" model carries a lower price point, this elevated domestic weighting created additional gross margin headwinds. Moreover, SG&A expenses exceeded expectations by approximately ¥20.8 billion, including preparation costs for launching the Nintendo eShop in Southeast Asia.
J.P. Morgan noted that excluding the SG&A overage, adjusted operating profit would be around ¥176 billion—actually near the upper end of sell-side expectations (¥150-170 billion range). In other words, core business performance wasn't as poor as the headline numbers suggest.
Nintendo 3Q26 results vs. sell-side expectations
Source: Bloomberg, Company data, Goldman Sachs, Jarvis
Hardware and Software: Two Different Stories
At the KPI level, hardware and software paint starkly different pictures.
Q3 hardware broadly exceeded expectations. Switch 2's 7.01 million unit sell-in beat most sell-side forecasts, with Nomura noting strong Japanese market demand as the primary driver. The legacy Switch performed in line with expectations at end-of-life, with Q3 sell-in of 1.36 million units.
Quarterly hardware sell-in trend (million units)
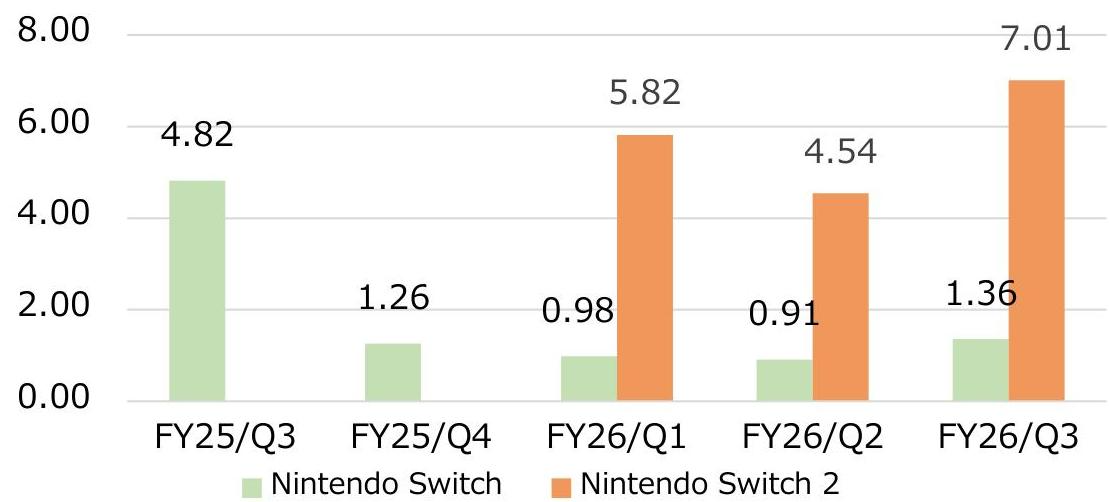
Source: Nintendo
Software, however, underperformed across the board. Switch 2 software sell-in for Q3 was 17.31 million units, missing market expectations of 23.02 million by roughly 25%. Nomura's analysis attributes this primarily to lower-than-expected sales of new titles like Hyrule Warriors: Age of Imprisonment and Metroid Prime 4: Beyond.
Even legacy Switch software came in below expectations, with Q3 sell-in of 47.37 million units versus implied expectations of 54.13 million—a miss of approximately 12%.
Quarterly software sell-in trend (million units)
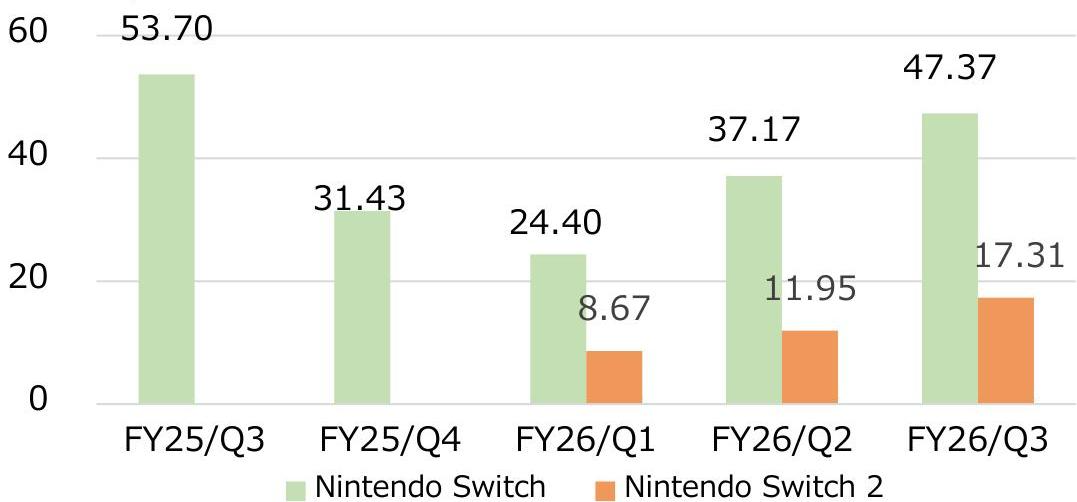
Source: Nintendo
That said, first-party software continues to demonstrate remarkable staying power. Mario Kart World achieved cumulative sales of 14.03 million units through the first three quarters. Pokémon Legends: Z-A contributed 8.41 million units on the Switch platform. Donkey Kong Bananza added another 4.25 million units. Digital sales also grew steadily to ¥282 billion, up 14.7% year-over-year.
First three quarters major game sales
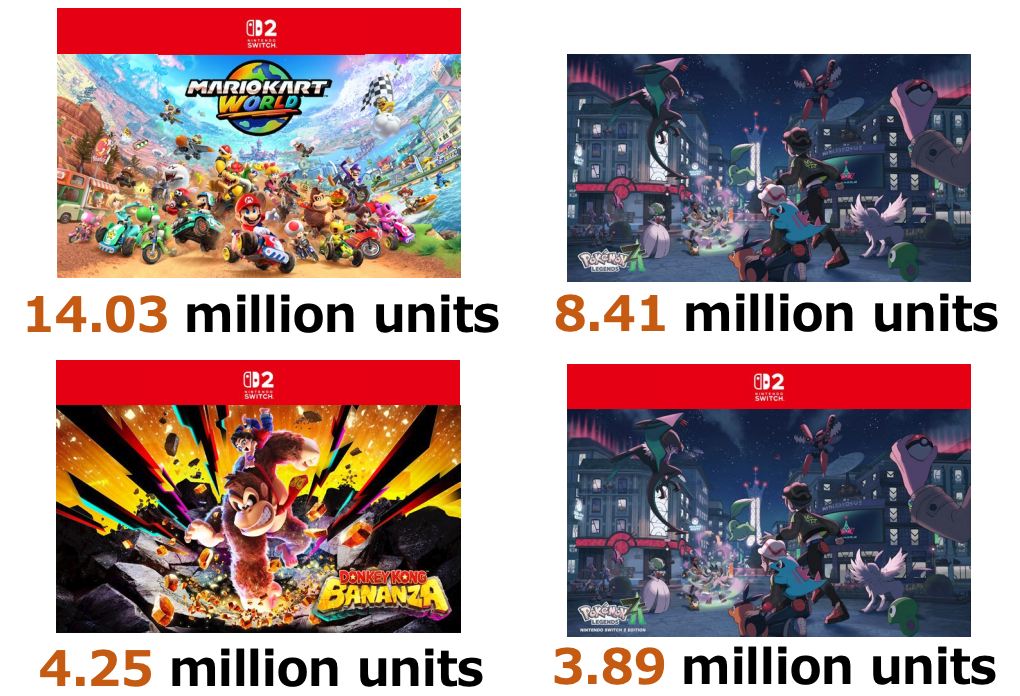
Source: Nintendo
Ultra-Conservative Full-Year Guidance
The company maintained its full-year guidance unchanged: net sales of ¥2.25 trillion, operating profit of ¥370 billion, and net income of ¥350 billion.
Given current dynamics, these figures appear extremely conservative.
First nine months net income already reached ¥358.9 billion—102.5% of full-year guidance, essentially already exceeding the annual target. Even accounting for the revised currency assumptions (USD/JPY and EUR/JPY lifted from 140/160 to 150/170 respectively, which should be profit-accretive), the company still declined to raise overall guidance.
Management's explanation: positive currency impacts were offset by negative effects from product and regional mix changes. This aligns precisely with sell-side concerns about margin pressure heading into the quarter.
More telling is the hardware unit guidance. Switch 2's full-year target remains at 19 million units, with 17.37 million already sold through the first three quarters. This implies Q4 guidance of just 1.63 million units—a stark contrast to Q3's 7.01 million.
The sell-side isn't buying it. Morgan Stanley and Goldman Sachs project Switch 2 full-year sales of 22 million units; Nomura forecasts 21 million. This conservative guidance approach is nothing new for Nintendo. As we noted in our previous Nintendo 2Q26 earnings analysis, Nintendo has consistently preferred setting modest expectations—a pattern traceable back to the original Switch launch in FY3/18.
Memory Prices: The Sword of Damocles
A core risk on the sell-side's radar is memory price inflation.
Management stated that through 3Q FY3/26, memory price increases had minimal cumulative impact, with limited effects expected for Q4. The company has secured supply capacity for FY3/26 and currently has no supply concerns for FY3/27.
However, CEO Shuntaro Furukawa acknowledged: if current conditions persist into the next fiscal year and beyond, profitability could face pressure. The company will keep all options open to address challenges, with the fundamental strategy being to avoid loss-making hardware sales globally.
Morgan Stanley expects the negative impact from memory price increases to materialize starting in FY3/27's June quarter, with their FY3/27 EPS forecast running 19% below consensus. Goldman Sachs, referencing the PS5's prior price increase, believes that even if Switch 2 experiences some degree of price hike, it would not materially impact installed base expansion.
Software Pipeline and IP Ecosystem: The Foundation for Growth
What underpins sell-side confidence in Nintendo's medium-term outlook is its rich software pipeline and IP ecosystem deployment.
On the Switch 2 platform, Mario Tennis Fever launches February 12, Pokémon Pokopia is slated for March 5 (Nomura projects potential sales of 5 million units), Yoshi and the Mysterious Book is planned for spring 2026, and Fire Emblem: Fortune's Weave along with Splatoon Raiders have been announced.
Nintendo Switch 2 released and upcoming first-party software
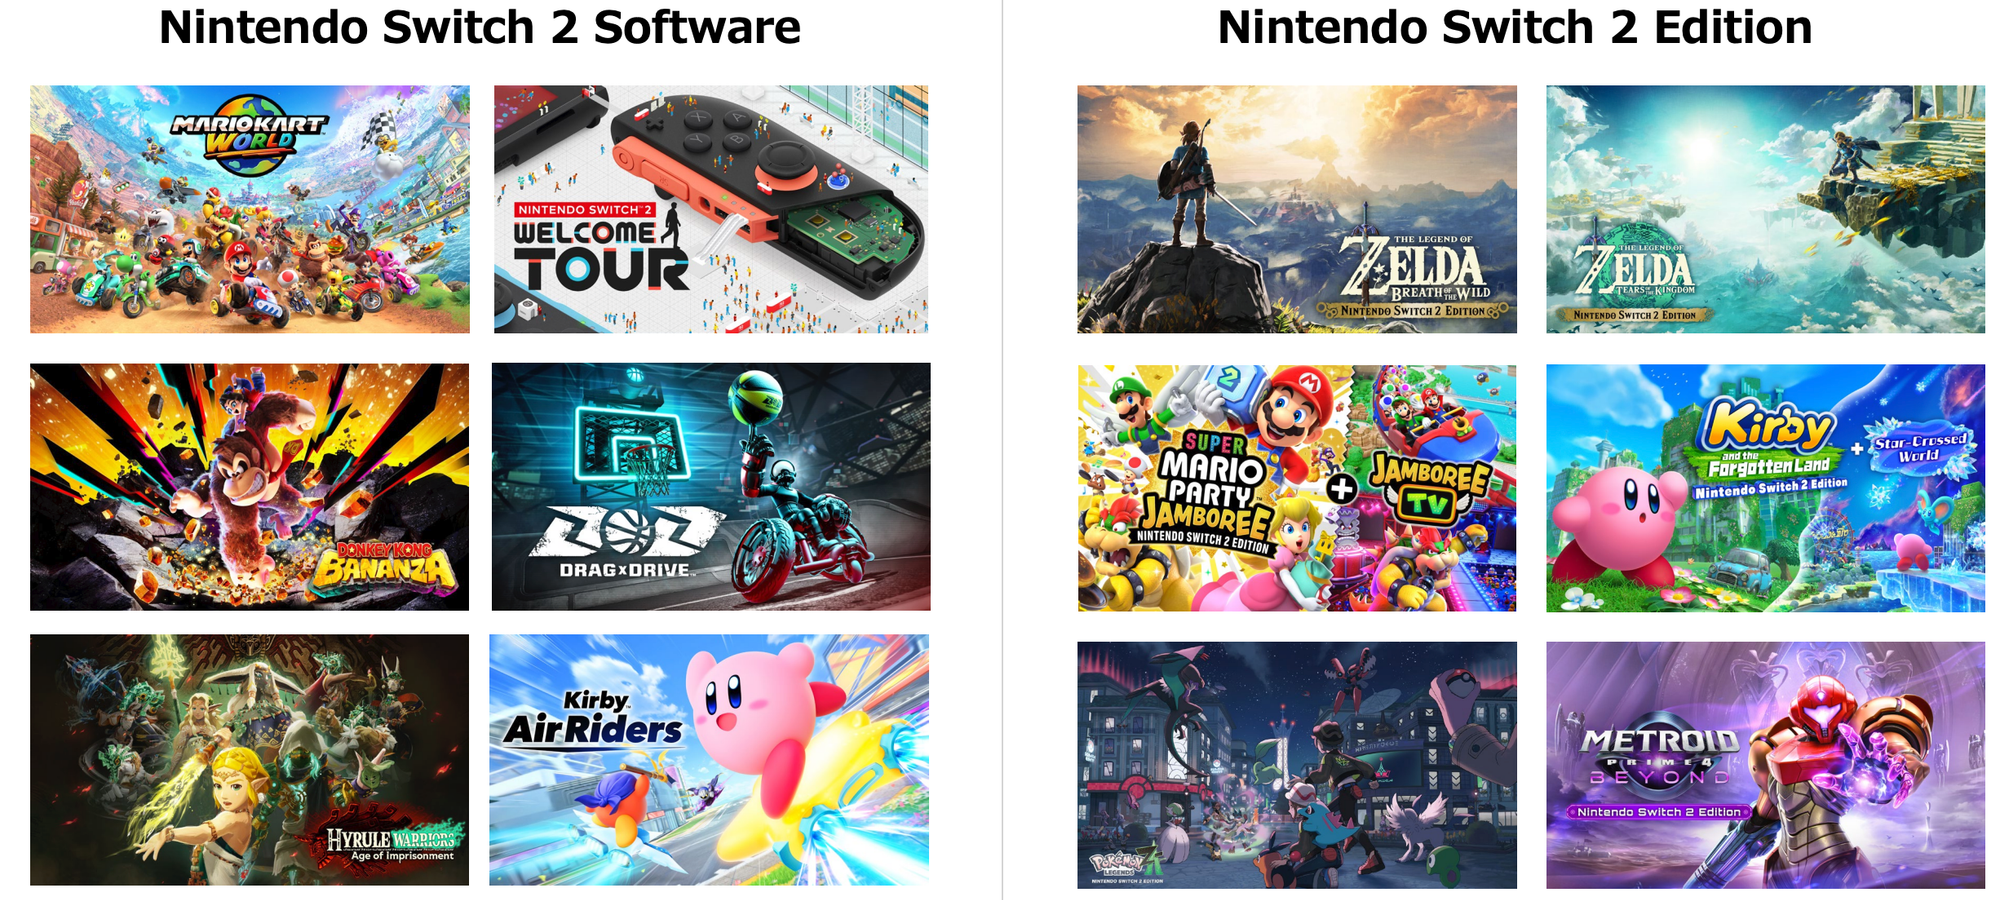
Source: Nintendo
The third-party lineup is equally compelling. Switch 2 versions of Final Fantasy VII Rebirth, Dragon Quest III HD-2D Remake, Resident Evil 4, and Monster Hunter Wilds are all in the pipeline. Goldman Sachs notes that third-party multi-platform strategies are shifting from Switch to Switch 2.
On the IP ecosystem front, The Super Mario Galaxy Movie, produced in collaboration with Illumination, is set for theatrical release in April. 2026 also marks the 40th anniversary of Super Mario and the 30th anniversary of Pokémon—Morgan Stanley sees this as signaling potential for software-related surprises.
Annual active users
Source: Nintendo
How to Read This Report
Nintendo's 3Q26 earnings present a textbook portrait of console transition dynamics: the revenue explosion from a strong new platform launch, colliding with margin compression from rising low-margin hardware mix. Both forces are at work simultaneously.
The Q3 operating profit miss warrants attention, but understanding its composition matters more—sales mix shifts and one-time expense overages, rather than structural problems in the core business. The company's ultra-conservative full-year guidance leaves ample room for future beats.
The two variables truly worth monitoring going forward: whether the software ecosystem's ramp can keep pace with hardware expansion, and the actual magnitude of memory price inflation's impact on margins in FY3/27 and beyond.
Nintendo's characteristically conservative style means that with this company, the reported numbers are often only half the story.
3Q26 Financial Statement Review
I will now share a more detailed analysis on the earnings reasult behind the paywall:


