
What's More Important: Buying Right or Buying Cheap? - The New Fundamental Law Defined by Hit Rate and Win/Loss Ratio
What matters more in investment: being right often, or winning big when you are? And how can we finally quantify the trade-off to build a better strategy?


The Ultimate Question in Investing: Are You Winning with Hit Rate or Win/Loss Ratio?
Every serious investor, from the fund manager overseeing billions to the individual analyst poring over screens, confronts a fundamental question: Is my performance a result of genuine skill, or just luck? And more importantly, how can we quantify and improve this "skill"?
For a long time, the standard answer from the world of finance has been the "Information Ratio." This metric measures your ability to generate consistent excess returns through active management. The classic "Fundamental Law of Active Management" provides a seemingly elegant formula: $IR \approx IC \cdot \sqrt{N}$. It suggests that your performance is a product of your predictive accuracy (Information Coefficient, IC) and your investment breadth (the number of independent decisions you make per year, N).
In practice, however, this formula often proves frustrating. Its biggest obstacle is the abstract nature of the Information Coefficient (IC). It requires you to assign a precise expected return to every single investment, a near-impossible task for investors who rely on qualitative factors like business model analysis or industry trends. More critically, it conflates two distinct abilities: "being right" about the direction and "trading well" to maximize gains and minimize losses.
So, is there a more intuitive framework, one that is closer to our investing reality, to dissect and guide our actions? A brilliant piece of research offers us just that—a precise scalpel for our analytical toolkit.
From Abstract to Concrete: Reconstructing Investment Skill with "Hit Rate" and "Win/Loss Ratio"
Instead of wrestling with the elusive "Information Coefficient," let's return to two of the most fundamental and tangible dimensions of investing:
- Hit Rate (HR): The frequency with which you make the correct decision. This directly reflects your market timing and stock selection abilities. An investor who decides by flipping a coin has a Hit Rate of 50%.
- Win/Loss Ratio (WL): The ratio of your average gain on winning trades to your average loss on losing trades. This embodies your position sizing and trading discipline—your ability to "let profits run and cut losses short."
The genius of this research lies in its ability to deconstruct abstract investment skill into these two observable, statistically measurable metrics through a concise binomial model. From this, a new "Fundamental Law of Active Management" emerges:
$$I R_{\text {annual }} \approx 1.6 \cdot \sqrt{N} \cdot\left(H R-\frac{1}{1+W L}\right)$$
This formula acts as a "skill diagnostic tool" for investors. It clearly reveals that superior long-term performance (Information Ratio) is the product of three key elements: your timing ability (HR), your position management skill (WL), and the frequency with which you apply them (N).
The Rules of Practice: Three Key Insights from the New Formula
The value of this formula extends far beyond theory. It provides us with three highly practical rules to diagnose and optimize our own investment systems.
Rule 1: Where is the "Break-Even" Point for Profitability?
To achieve a positive risk-adjusted return (i.e., IR > 0), your combination of Hit Rate and Win/Loss Ratio must satisfy one basic condition:
$$H R > \frac{1}{1+W L}$$
This inequality masterfully illustrates the substitutable relationship between Hit Rate and Win/Loss Ratio. It tells us that there is more than one path to profitability:
- If you are a high-Hit Rate player but your Win/Loss Ratio is average (e.g., WL is close to 1.0), your Hit Rate must consistently be above 50%.
- If you are a high-Win/Loss Ratio player, as many trend-followers or value investors are, you can succeed even with a modest Hit Rate. For instance, if your WL reaches 1.5 (you make $1.50 for every $1 you lose), you only need a 40% Hit Rate to generate positive returns. You can afford to be wrong many times, as a few large wins will cover all the small losses.
- Conversely, if your trading habit is to "take small profits and big losses" (e.g., WL is only 0.67), you would need a staggering Hit Rate of over 60% just to break even.
Rule 2: What Should You Prioritize at the Beginning?
For an investor just starting out (Hit Rate near 50%, Win/Loss Ratio near 1.0), should the priority be improving the Hit Rate or optimizing the Win/Loss Ratio?
The answer might be surprising. The research shows that, at the initial stage, the marginal contribution of improving Hit Rate to the Information Ratio is a full four times that of improving the Win/Loss Ratio. This means that increasing your Hit Rate from 50% to 51% has roughly the same impact as increasing your Win/Loss Ratio from 1.0 to 1.04.
Therefore, in the early stages of your investment practice, focusing your energy on refining your research framework and improving the accuracy of your decisions is likely the fastest path to superior performance.
Rule 3: The Power of Repetition
The $\sqrt{N}$ in the formula reaffirms the importance of investment breadth. Assuming the quality of your individual decisions is positive (the term in the parentheses is greater than zero), the more independent, high-quality decisions you make, the more stable and impressive your annualized performance will be. This underscores that the cornerstone of professional investing is building a repeatable, scalable process, not relying on occasional strokes of genius.
Facing Reality: Don't Forget the Market's "Fat Tails"
Of course, any financial model must be tested against reality. Real-world financial markets are filled with extreme events (i.e., "fat tails"), exhibiting volatility that far exceeds theoretical normal distributions. This fat-tail characteristic can amplify losses and thus "punish" our Information Ratio.
The framework cleverly accounts for this. We simply need to adjust the coefficient of 1.6 downwards based on the market's actual "tail fatness." For example, in a market with extremely high excess kurtosis, this coefficient might drop from 1.60 to 1.41. What's important is that this adjustment only affects the final scaling factor; it does not change the core structural relationship between Hit Rate, Win/Loss Ratio, and Investment Breadth.
To validate the model, the researchers backtested various common quantitative strategies on the CSI 300 Index. The results were encouraging: the theoretical IR calculated by the new formula showed a high degree of consistency with the strategies' actual historical IR.
Theoretical IR vs. Actual IR (Source: 微信公众平台)
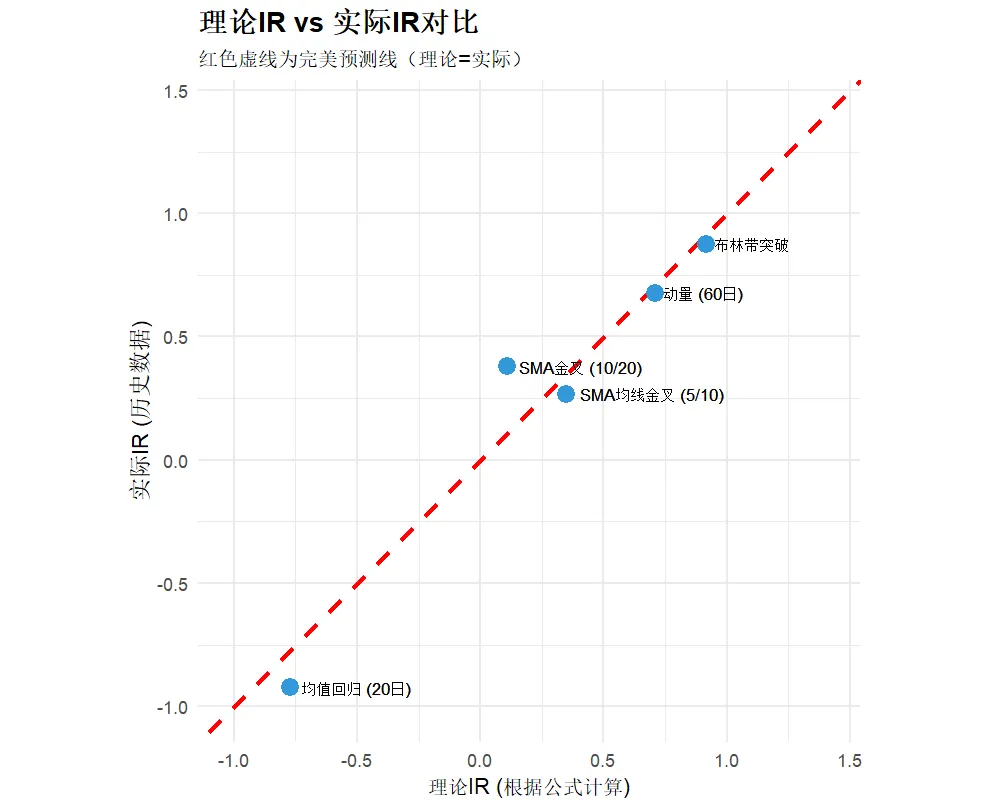
As the chart shows, most strategies (such as Bollinger Band breakouts, Momentum, and SMA golden crosses) cluster tightly around the "Theoretical = Actual" red dashed line, providing strong evidence of the framework's effectiveness in explaining and predicting a strategy's long-term performance.
Conclusion
The true contribution of this research is that it provides us with a powerful framework that is quantifiable, diagnostic, and optimizable for examining our own investment capabilities. It transforms the vague "art of investing" into a methodical "craft" that can be honed.
With the formula $I R_{\text {annual }} \approx 1.6 \cdot \sqrt{N} \cdot\left(H R-\frac{1}{1+W L}\right)$, we can, like a physician, clearly diagnose the weaknesses in our investment system—are we not "seeing" the market accurately enough (low HR), or are we not "acting" effectively enough (low WL)? Based on this diagnosis, we can engage in targeted, deliberate practice for improvement. Hopefully, this powerful mental model can bring some inspiration to your own investment journey.


