
When Intuition Fails: The Data-Driven Takedown of "Buying the Dip"
Catching a falling knife feels heroic, but what if the data proves that simply holding on—or even following the trend down—is the smarter play?


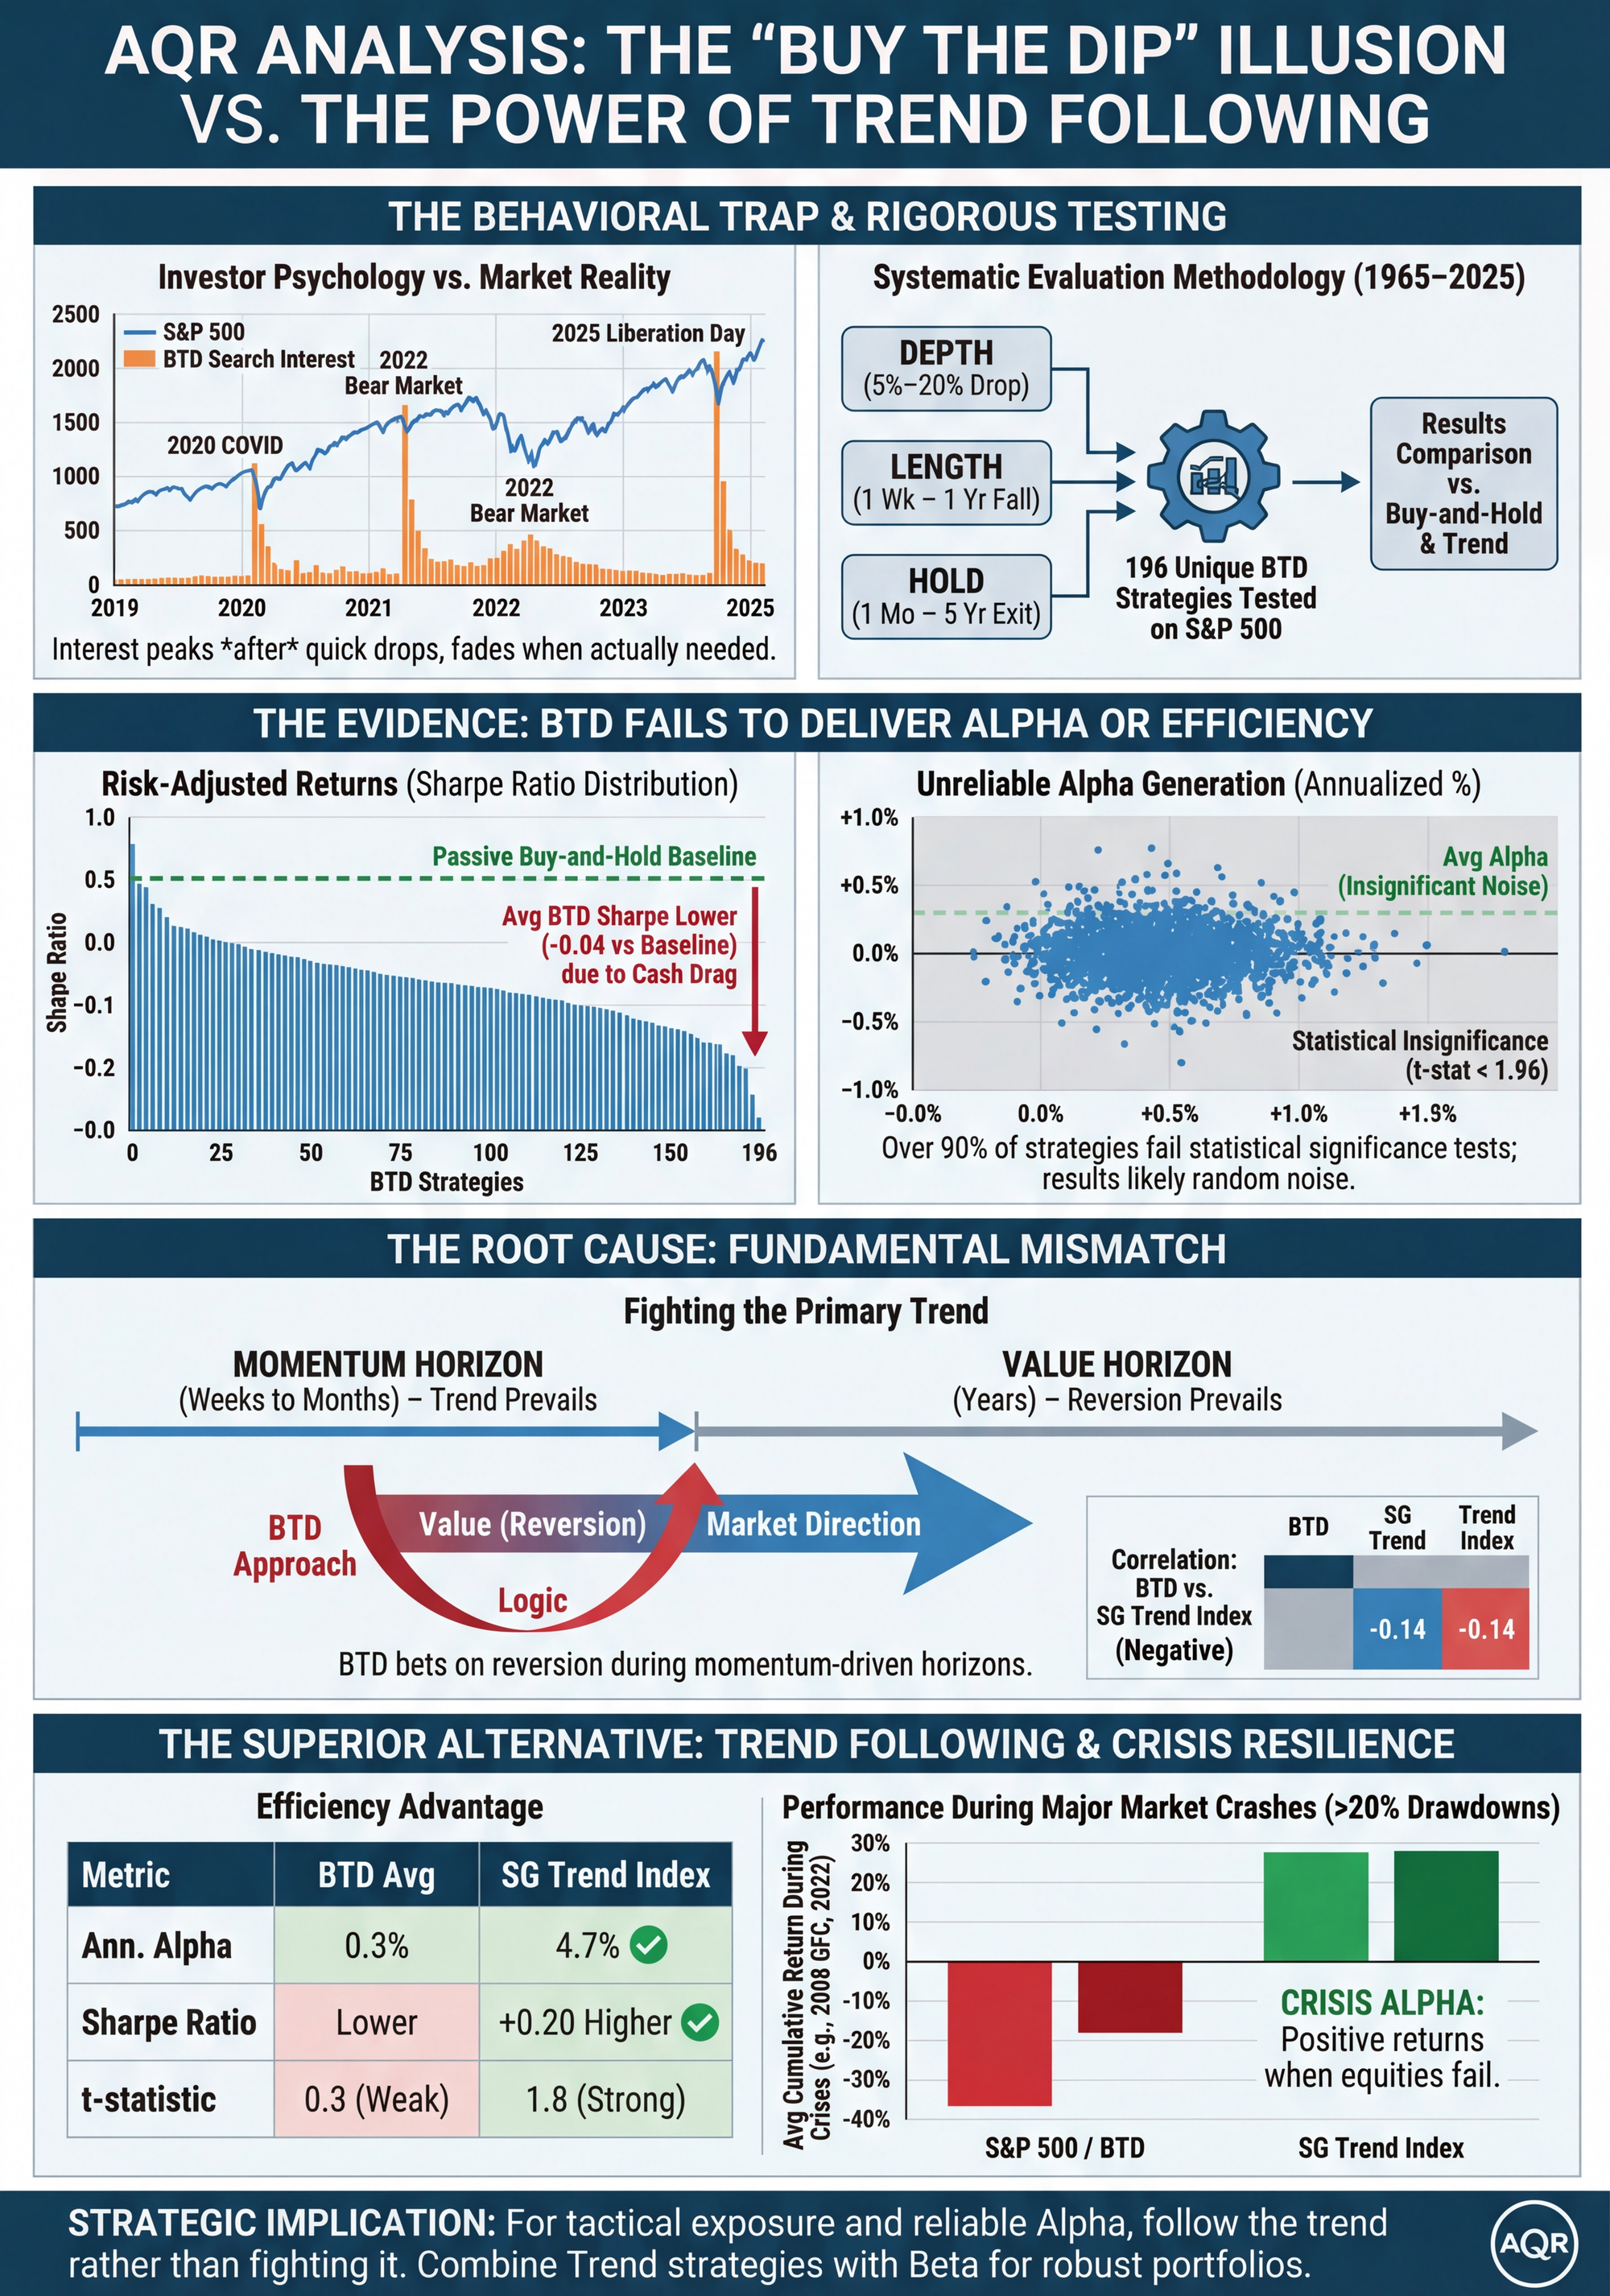
In the world of investing, few concepts are as seductive as "Buy the Dip."
Whenever the market takes an unexpected plunge and panic spreads, our investment instincts seem to scream, "It's on sale! Buy now!" It sounds perfectly logical, the quintessential application of the timeless adage to "buy low, sell high."
This impulse is not without reason.
As the data below shows, after a brief and sharp market pullback (like the COVID-19 sell-off in 2020), Google search interest for "Buy the Dip" spikes dramatically. But when the decline evolves into a prolonged downturn (as in 2022), that interest quickly fades. This is a clear reflection of our collective psychology: we yearn to seize fleeting opportunities but fear the bottomless bear market.
Google Search Interest for "Buy the Dip" and Market Pullbacks
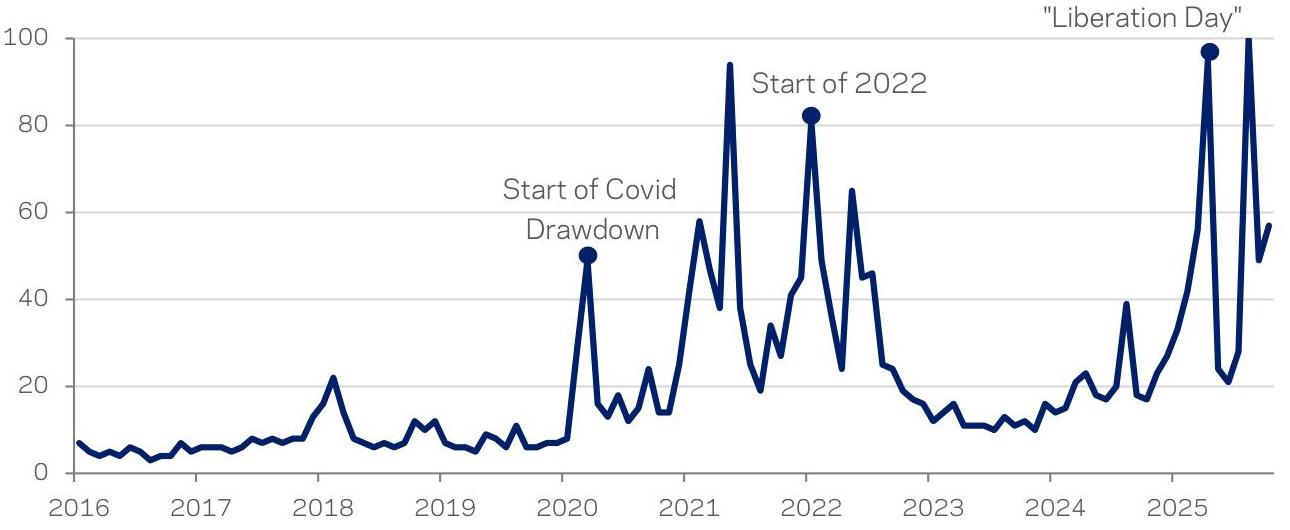
Source: AQR, Google Trends
We often feel like we're playing the part of a contrarian investor, being greedy when others are fearful.
But here's the problem: to prove that buying the dip is a brilliant strategy, it's not enough to show that "stocks eventually recover." That merely reaffirms the long-term value of holding equities. We must prove that buying during a dip is a tactically superior moment to be invested than any other time.
Quantitative investing giant AQR recently conducted an exceptionally systematic and rigorous review of this popular strategy.
The conclusions might challenge your intuition.
A Scientific Scrutiny: When Intuition Meets Data
To avoid subjective bias, AQR's analysis is impeccably rigorous. They didn't just test one version of the strategy. Instead, they constructed and backtested a vast matrix of 196 different "Buy the Dip" strategies on nearly 60 years of S&P 500 historical data, from 1965 to 2025.
This comprehensive test combined three core variables, with parameters chosen to represent a wide range of pullbacks seen in the S&P 500's history:
- Depth: Buying after a decline of 5%, 10%, 15%, or 20%.
- Length: Defining the dip as occurring over 1 week, or as long as 1 year.
- Hold: Holding the position for as short as 1 month, or as long as 5 years.
The results, however, are sobering.
Finding #1: The "Value" of BTD is Worse Than Just Holding
First, let's look at the Sharpe Ratio, a key metric for an investment's risk-return profile. It tells us how much excess return you get for each unit of risk you take.
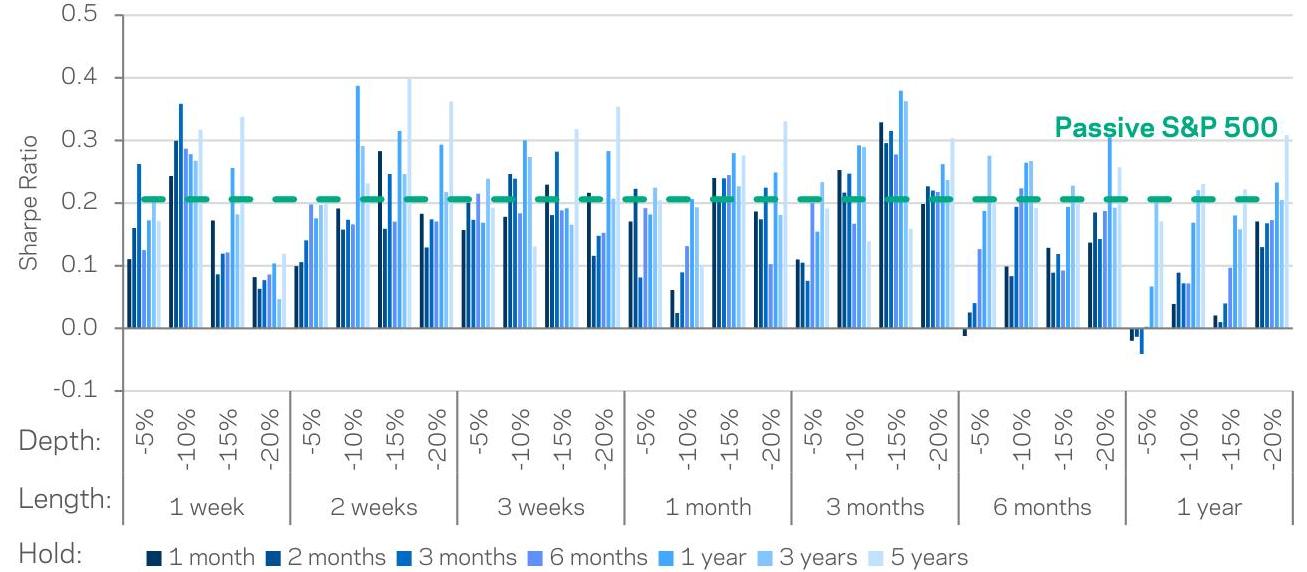
The chart below clearly illustrates the performance of these 196 strategies. The green dashed line represents the simplest strategy of all: Buy-and-Hold the S&P 500 index. The dense cluster of blue bars represents the 196 BTD strategies.
Sharpe Ratios of Various BTD Strategies (1965-2025)
Source: AQR
A single glance reveals a stark reality: the vast majority of blue bars languish below the green line.
This means that, from a risk-adjusted perspective, the intricate dance of market timing to buy the dip generally yields worse returns than simply buying and holding. The data shows that over 60% of BTD strategies have a lower Sharpe ratio than passive holding. More convincingly, using recent data that includes dividends (from 1989 to 2025), the average Sharpe ratio of BTD strategies is 0.27 lower than passive holding, which translates to a massive 47% underperformance.
The reason is simple: while waiting for that "perfect bottom," your capital often sits idle in cash, missing out on the Equity Risk Premium that the market provides most of the time.
Finding #2: The "Excess Return" is a Statistical Mirage
Perhaps you might say, "I don't care about the risk-return profile, as long as I can beat the market." This brings us to Alpha, the metric that measures a manager's ability to generate excess returns through market timing or stock selection.
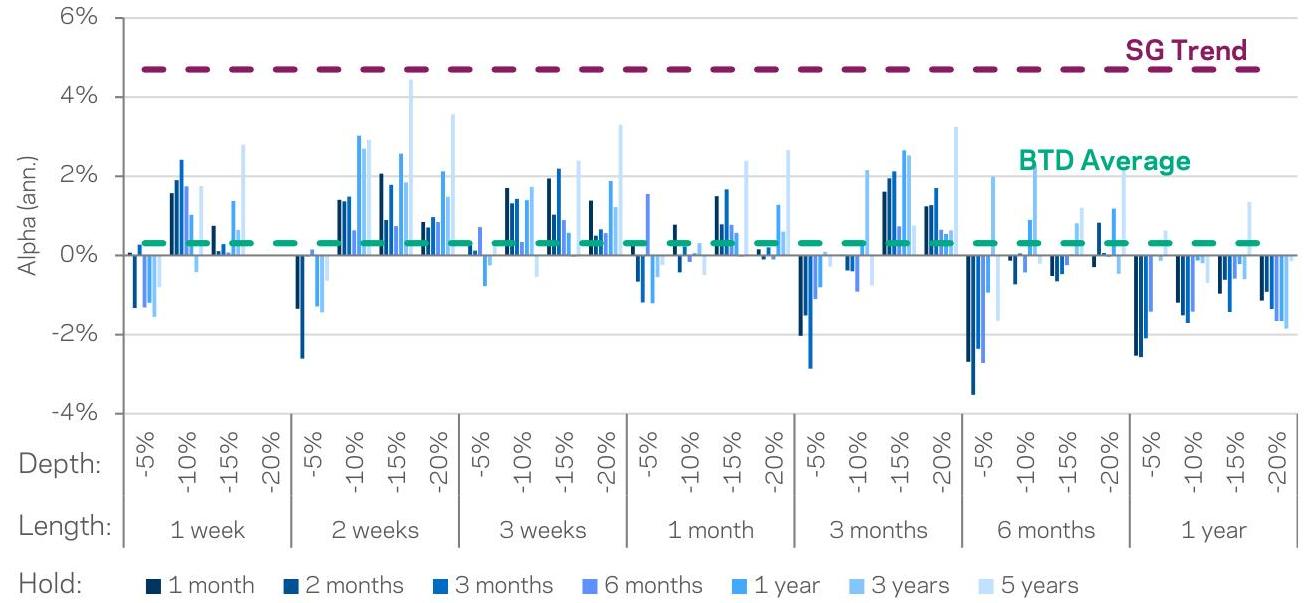
Unfortunately, the data once again delivers a negative verdict. The average annualized Alpha generated by all BTD strategies is a mere 0.5%, almost negligible, and extremely volatile.
Even more damning, this meager Alpha is not statistically significant. Of the 196 strategies, only 8% barely passed the 95% confidence interval test. When accounting for multiple-testing bias (because testing many strategies increases the odds of finding one that works by pure luck), the required level for statistical significance (the t-statistic) rises to about 3.52. Not a single BTD strategy met this standard.
This points to a powerful conclusion: the excess returns from seemingly successful BTD trades are, statistically speaking, indistinguishable from random noise.
The Core Issue: Playing a Value Game in a Momentum World
Why does such an intuitive strategy perform so poorly under rigorous testing?
AQR's research offers a profound insight: the essence of the Buy the Dip strategy is a fundamental mismatch of playing a "Value" game on a "Momentum" timeline.
- Momentum refers to the tendency of market trends to persist in the short to medium term (weeks to months). Winners keep winning, and losers keep losing.
- Value refers to the idea that prices eventually revert to their intrinsic worth. This typically happens over a much longer time horizon (years), often in line with business cycles.
When you rush in to "buy the dip," you are effectively fighting against the market's short-term downward momentum, with which BTD has an average correlation of -0.14. You are betting on a value reversion that may take years to materialize, but you are placing that bet on a battlefield dominated by momentum.
The Better Alternative: Trend Following
If going against the trend is a trap, what about following it?
The study directly compares BTD strategies with Trend Following, represented by the SG Trend Index. The contrast is stark.
Trend Following not only wins on a risk-adjusted basis, but its annualized Alpha of 4.7% is far superior to the average of all BTD strategies and even surpasses the single best-performing strategy among the 196 tested.
Trend Following Alpha vs. BTD Average
Source: AQR
The most critical difference emerges when protection is needed most.
During the S&P 500's major crises with declines of over 20%, BTD strategies, by continuously adding to positions on the way down, lost an average of 18.4%.
In contrast, Trend Following strategies, by identifying and following the downward trend (e.g., by taking short positions), actually generated an average positive return of 28.6%. The most iconic example: during the Global Financial Crisis from October 2007 to March 2009, as the S&P 500 crashed by 55.3%, the trend strategy gained 31.7%.
One amplifies losses; the other offers a shield.
Strategic Application: Making Alpha and Beta Coexist
So, does this mean investors should abandon the market itself (Beta) and switch entirely to a trend strategy (Alpha)? Not necessarily.
A more sophisticated approach is to combine them. AQR's research shows that allocating a portion of a traditional Global 60/40 portfolio (e.g., 20%) to a trend-following strategy can significantly optimize the portfolio. Methods like "Portable Alpha" make it possible to "graft" the Alpha from a trend strategy onto an existing portfolio. This can be done without sacrificing—and at times, even enhancing—overall market exposure.
This approach allows one to enjoy the market's long-term growth while gaining a valuable buffer and source of excess returns during periods of severe market turmoil.
Final Thoughts
Even when the analysis is narrowed down to the Magnificent 7, the most dazzling tech giants of recent years, the conclusion remains unchanged: buying the dip is still not a superior strategy to simply holding.
This research serves as a reminder not to judge an asset as "cheap" simply because its price has fallen. In a trending market, the force of momentum is far more powerful and persistent than we often imagine.
The takeaway is clear.
For most long-term investors, the simplest and most effective strategy may just be to Buy-and-Hold, enjoying the market's long-term growth.
And if you wish to actively manage risk and seek excess returns, Trend Following offers a far more reliable framework than buying the dip—and it can be integrated as a powerful tool within your core portfolio.
Ultimately, wisdom in investing is sometimes not about bravely catching a falling knife, but about knowing when to ride the wave, or simply stay in the boat and watch the tides ebb and flow.


